Announcement

Collapse
No announcement yet.
X
  • Filter
  • Time
  • Show
Clear All
new posts

  • Color palette in spmap

    Hello statalisters

    I am creating several maps showing prison rates using Maurizio Pisati's user written command smpap in Stata 13 SE. I seem to have problems with the colors. I use fcolor(Blues) and custom color breaks to show intensity. The command draws the map but countries like the US or Russia, for example, do not appear with the highest intensity of the Blues color palette. I have tried different custom breaks without much luck. I run out of ideas to fix this.
    Any help will be greatly appreciated. Below I enclose the code for the map and a picture of the resulting map


    #delimit;
    spmap prison using worldcoor.dta, id(id) fcolor(Blues)
    clmethod(custom) clbreaks(0 100 300 600 800)
    legend(symy(*2) symx(*2) size(*2) position (9))
    legorder(hilo) legend(label(2 "0 to 100") label(3 "100 to 300" )label(4 "300 to 600" )
    label(5 "600 to 800" ) size(vsmall))
    ;
    # delimit cr


  • #2
    Originally posted by Erik Alda View Post
    Hello statalisters

    I am creating several maps showing prison rates using Maurizio Pisati's user written command smpap in Stata 13 SE. I seem to have problems with the colors. I use fcolor(Blues) and custom color breaks to show intensity. The command draws the map but countries like the US or Russia, for example, do not appear with the highest intensity of the Blues color palette. I have tried different custom breaks without much luck. I run out of ideas to fix this.
    Any help will be greatly appreciated. Below I enclose the code for the map and a picture of the resulting map

    #delimit;
    spmap prison using worldcoor.dta, id(id) fcolor(Blues)
    clmethod(custom) clbreaks(0 100 300 600 800)
    legend(symy(*2) symx(*2) size(*2) position (9))
    legorder(hilo) legend(label(2 "0 to 100") label(3 "100 to 300" )label(4 "300 to 600" )
    label(5 "600 to 800" ) size(vsmall))
    ;
    # delimit cr
    Erik, why should these particular countries appear with the highest intensity?
    Perhaps summarizing/tabulating your outcome variable (prison) can make it more clear.

    Or use amap where you can set the custom breaks and color palette using dialog windows:
    http://go.worldbank.org/ODS4NKQBB0
    http://siteresources.worldbank.org/I...DePT_Maps2.pdf

    Best, Sergiy

    Comment


    • #3
      Sergyi Thanks. The reason being because the US and Russia have high rates of prisoners. I tried to attach the resulting map but gave me an error. Have tried adept 2.0 but can't seem to get the colors. Thanks for your help

      Comment


      • #4
        Dear Erik,
        here's an attempt to reproduce the desired map based on the datasets distributed with spmap:

        Code:
        use "Italy-RegionsData.dta", clear
        generate x = round(runiform()*800)
        
        #delimit;
        spmap x using "Italy-RegionsCoordinates.dta", id(id) fcolor(Blues)
        clmethod(custom) clbreaks(0 100 300 600 800)
        legend(symy(*2) symx(*2) size(*2) position (9))
        legorder(hilo) legend(label(2 "0 to 100") label(3 "100 to 300" )label(4 "300 to 600" )
        label(5 "600 to 800" ) size(vsmall))
        label(xcoord(xcoord) ycoord(ycoord) label(x))
        ;
        # delimit cr
        To display both region colors and values of variable x, I added option label(xcoord(xcoord) ycoord(ycoord) label(x)) to your original command. As shown by the resulting map, everything seems to work just fine in this example.
        Best wishes,
        Maurizio


        Click image for larger version

Name:	Map.png
Views:	1
Size:	195.2 KB
ID:	278065

        Comment


        • #5
          Thanks, Maurizio

          I have tried again and I am running into the same problem. I have checked the merged files and they are ok. Based on my analysis, the US should be have the darkest blue shade because of the prisoner's rate (second highest in the world). I attach the map for perusals. This is the only map that has given me trouble. The rest have come out fine.
          Thanks

          Comment


          • #6
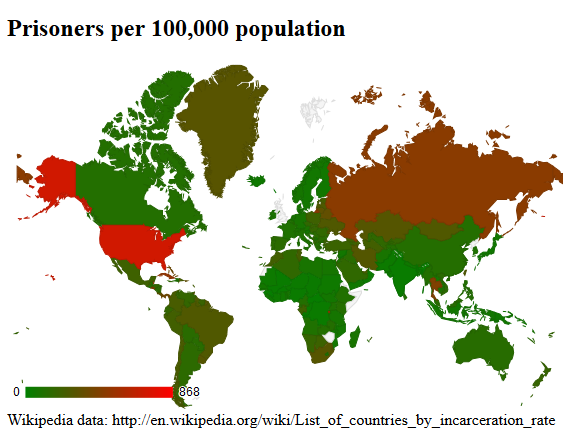
            If data is at countries level, I'd go with the GEOCHART command.
            See output here or a static image here.


            Program is : http://radyakin.org/statalist/2014/p...s/prisoners.do
            (will load data automatically, but requires geochart installed, type: findit geochart)

            Best, Sergiy Radyakin
            Last edited by Sergiy Radyakin; 01 Oct 2014, 14:05. Reason: added picture

            Comment


            • #7
              Thanks, Sergyi
              That's exactly it. I don't understand why I cannot get the color intensity in spmap. Is there a way to get blues with geochart. Thanks again!
              Erik

              Comment


              • #8
                Dear Erik,
                your problem stems from the fact that the ID variables in your "data" and "basemap" datasets do not match, i.e., same IDs do not correspond to same countries. Once you re-align the two datasets, the problem should disappear.
                Best wishes,
                Maurizio

                Comment

                Working...
                X