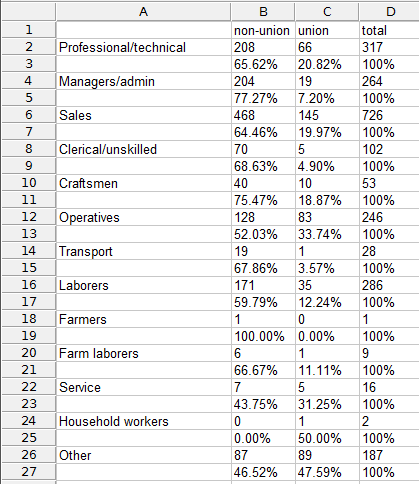
Hi, I am trying to get frequency and percentage data from a list of 20 binary variables. I did two-way tabulate but had trouble finding ways to export the results into a particular sheet of an excel file (so each variable has its own sheet). I spent couple of hours and tried many different methods but still could not get it to work.
The results I want to export looks like this:
I tried putexcel, but it seems to work only with data stored in a matrix and it does not include the row percentages.
tab year black, row matcell(freq) matrow(year) matcol(black)
putexcel A1=("Year") B1=("0") C1=("1") D1=("Percent") using Variable_workbook, modify sheet("black")
putexcel A2=matrix(year) B2=matrix(freq) D2=matrix(freq/r(N)) using Variable_workbook, modify ///
sheet("black")
So my first question is, is there any way to store the results of a two-way tabulation as a matrix? and is it possible to save the row percentages?
I tried tabout but did not know how to export it.
I also explored esttab and logout (after tabout), and I always got stuck on the fact that I don't know how to make the export into a specific sheet in excel, rather the entire .csv file.
(see below)
estpost tab black year
esttab using "$data/mytable.csv", /*
*/ cell(b(fmt(2)) /*
*/ colpct(fmt(2))) /*
*/ unstack noobs /*
*/ replace
logout, clear: tabout year black using test, replace ///
cells(freq col) format(0 1) clab(No. Col_% Cum_%)
logout, save(mytable) clear excel replace
Help is much appreciated!
The results I want to export looks like this:
| black | |||
| Year | 0 | 1 | Total |
| 2006 | 21,298 | 1,065 | 22,363 |
| 95.24 | 4.76 | 100 | |
| 2007 | 22,863 | 1,134 | 23,997 |
| 95.27 | 4.73 | 100 | |
| 2008 | 24,025 | 1,304 | 25,329 |
| 94.85 | 5.15 | 100 | |
| 2009 | 28,715 | 1,737 | 30,452 |
| 94.3 | 5.7 | 100 | |
| 2010 | 29,970 | 2,088 | 32,058 |
| 93.49 | 6.51 | 100 | |
| 2011 | 32,142 | 2,241 | 34,383 |
| 93.48 | 6.52 | 100 | |
| 2012 | 34,327 | 2,341 | 36,668 |
| 93.62 | 6.38 | 100 | |
| 2013 | 36,247 | 2,623 | 38,870 |
| 93.25 | 6.75 | 100 | |
| Total | 229,587 | 14,533 | 244,120 |
| 94.05 | 5.95 | 100 |
tab year black, row matcell(freq) matrow(year) matcol(black)
putexcel A1=("Year") B1=("0") C1=("1") D1=("Percent") using Variable_workbook, modify sheet("black")
putexcel A2=matrix(year) B2=matrix(freq) D2=matrix(freq/r(N)) using Variable_workbook, modify ///
sheet("black")
So my first question is, is there any way to store the results of a two-way tabulation as a matrix? and is it possible to save the row percentages?
I tried tabout but did not know how to export it.
I also explored esttab and logout (after tabout), and I always got stuck on the fact that I don't know how to make the export into a specific sheet in excel, rather the entire .csv file.
(see below)
estpost tab black year
esttab using "$data/mytable.csv", /*
*/ cell(b(fmt(2)) /*
*/ colpct(fmt(2))) /*
*/ unstack noobs /*
*/ replace
logout, clear: tabout year black using test, replace ///
cells(freq col) format(0 1) clab(No. Col_% Cum_%)
logout, save(mytable) clear excel replace
Help is much appreciated!


Comment