Hi all!
I have only recently started working with Stata and would like some help!
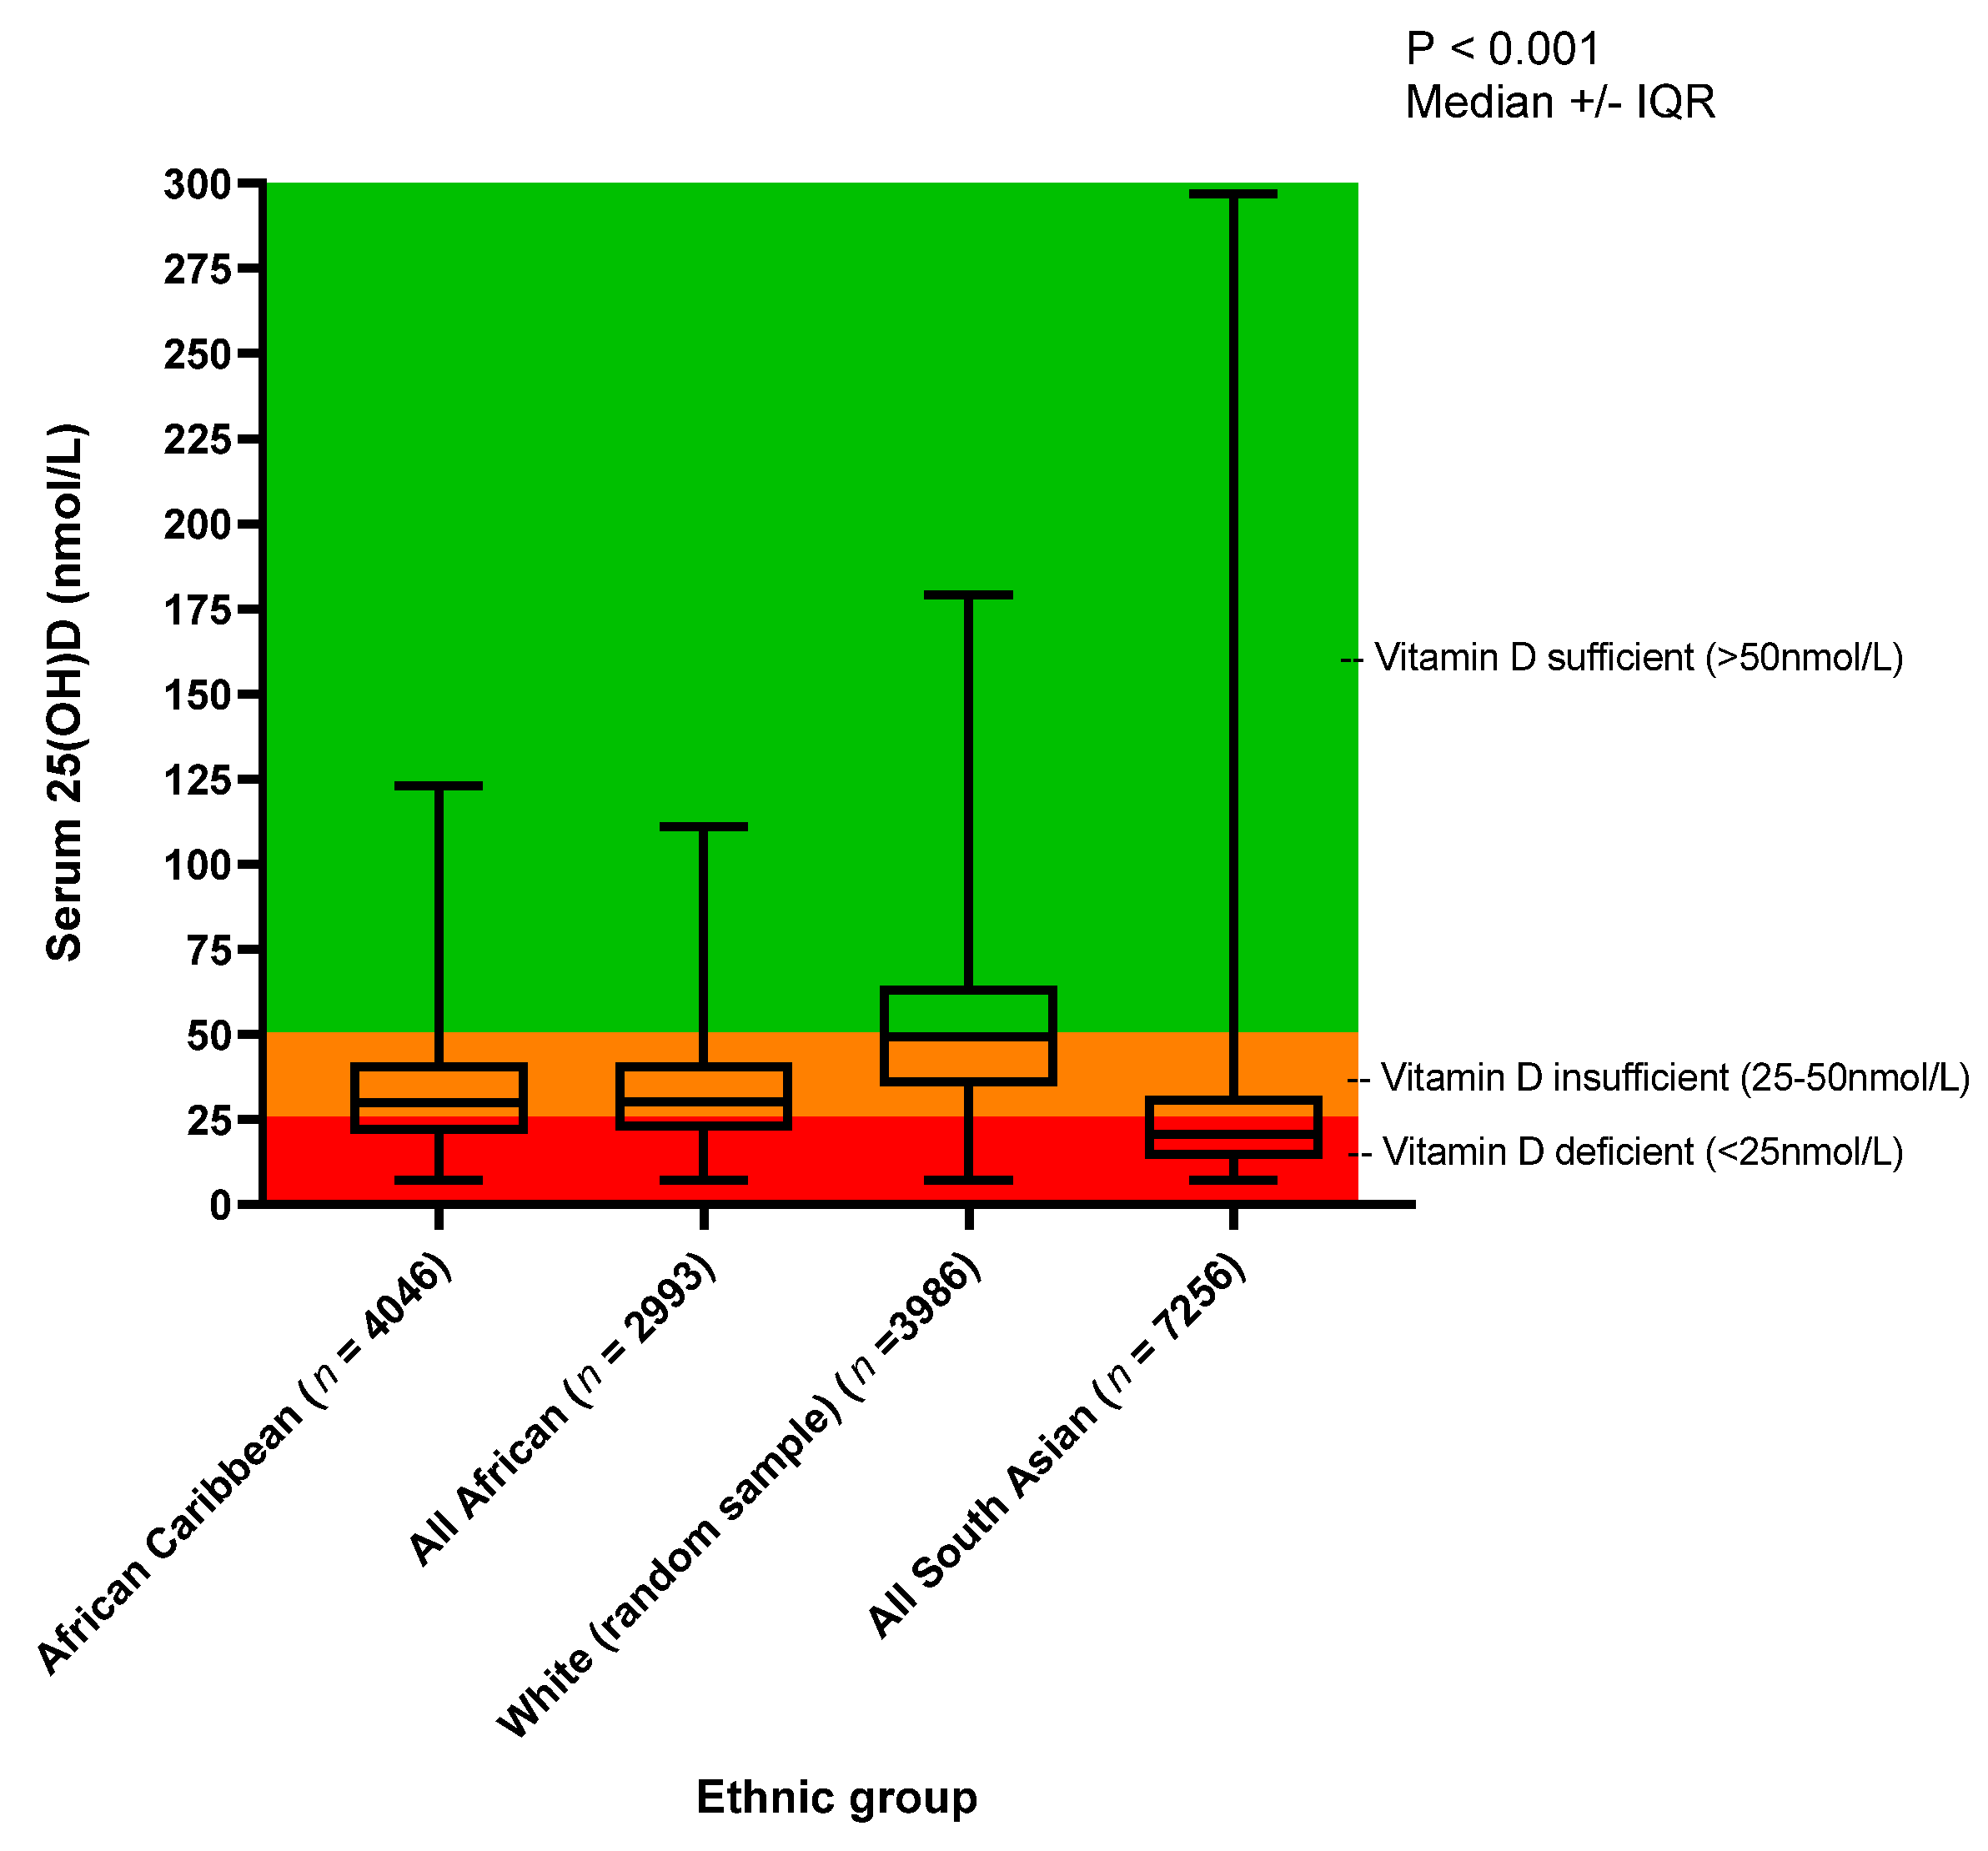
I am looking for help with changing background colours according to my y-axis values (alternatives it can be by categories in alternative variable) for my boxplot. I have found previous discussion: https://www.statalist.org/forums/for...in-twoway-plot , but I cannot figure out how to apply it to a boxplot (or if it's possible).
More precisely, I would love to recreate something like this (which was done in GraphPrism):


Comment