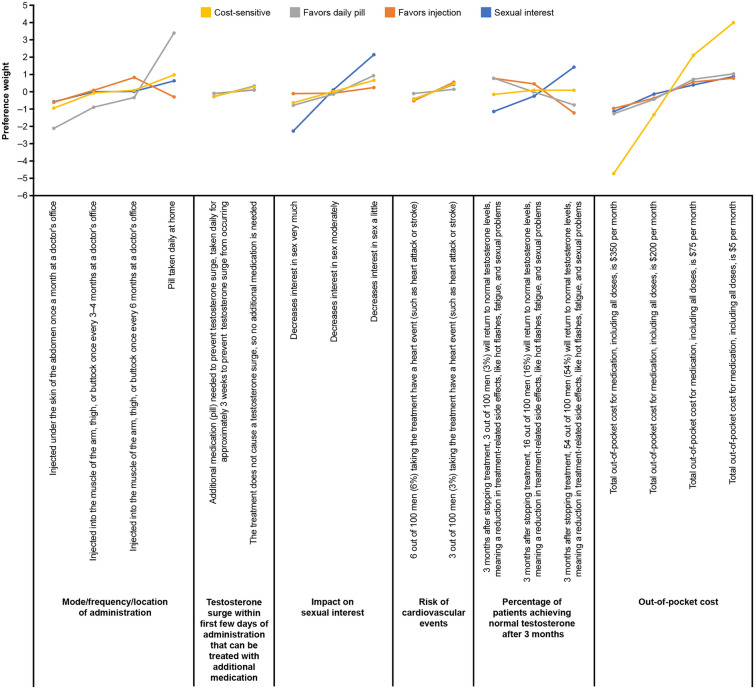
Hello, I am very new to Stata and am researching if someone would self-identify as being ill from a publicized foodborne illness or not and why. I collected data using a Discrete Choice Experiment. I analyzed my data using a mixed logit model. I have four attributes: the number of people (3 levels at 20, 200, 8500), symptoms (2 levels, included or not), FDA (2 levels, included or not), and a call to Action (2 levels, included or not). Each person was given six choice set questions. My data is set up the long way (example below with 2 participants data). I used effects coding on the 20 people level, omitting the 20). How do I use STATA to create a Spaghetti Plot?
do
| Participant_ID | Group | Choice_Set_ID | Alternative | Chosen | People | Symptoms | FDA |
| 1 | 1 | Block_a_choice Set_1_Response | A | 1 | 85 | 1 | 1 |
| 1 | 1 | Block_a_choice Set_1_Response | B | 0 | 0.2 | -1 | -1 |
| 1 | 1 | Block_a_choice Set_1_Response | Neither | 0 | 0 | 0 | 0 |
| 1 | 5 | Block_a_choice Set_5_Response | A | 1 | 85 | -1 | -1 |
| 1 | 5 | Block_a_choice Set_5_Response | B | 0 | 0.2 | 1 | 1 |
| 1 | 5 | Block_a_choice Set_5_Response | Neither | 0 | 0 | 0 | 0 |
| 1 | 9 | Block_a_choice Set_9_Response | A | 1 | 2 | 1 | 1 |
| 1 | 9 | Block_a_choice Set_9_Response | B | 0 | 85 | -1 | -1 |
| 1 | 9 | Block_a_choice Set_9_Response | Neither | 0 | 0 | 0 | 0 |
| 1 | 13 | Block_a_choice Set_13_Response | A | 0 | 2 | -1 | -1 |
| 1 | 13 | Block_a_choice Set_13_Response | B | 1 | 85 | 1 | 1 |
| 1 | 13 | Block_a_choice Set_13_Response | Neither | 0 | 0 | 0 | 0 |
| 1 | 17 | Block_a_choice Set_17_Response | A | 1 | 2 | 1 | 1 |
| 1 | 17 | Block_a_choice Set_17_Response | B | 0 | 0.2 | -1 | -1 |
| 1 | 17 | Block_a_choice Set_17_Response | Neither | 0 | 0 | 0 | 0 |
| 1 | 21 | Block_a_choice Set_21_Response | A | 1 | 2 | -1 | -1 |
| 1 | 21 | Block_a_choice Set_21_Response | B | 0 | 0.2 | 1 | 1 |
| 1 | 21 | Block_a_choice Set_21_Response | Neither | 0 | 0 | 0 | 0 |
| 2 | 2 | Block_b_choiceSet_2_response | A | 1 | 85 | 1 | 1 |
| 2 | 2 | Block_b_choiceSet_2_response | B | 0 | 0.2 | -1 | -1 |
| 2 | 2 | Block_b_choiceSet_2_response | Neither | 0 | 0 | 0 | 0 |
| 2 | 6 | Block_b_choiceSet_6_response | A | 0 | 85 | -1 | -1 |
| 2 | 6 | Block_b_choiceSet_6_response | B | 1 | 0.2 | 1 | 1 |
| 2 | 6 | Block_b_choiceSet_6_response | Neither | 0 | 0 | 0 | 0 |
| 2 | 10 | Block_b_choiceSet_10_response | A | 1 | 2 | 1 | 1 |
| 2 | 10 | Block_b_choiceSet_10_response | B | 0 | 85 | -1 | -1 |
| 2 | 10 | Block_b_choiceSet_10_response | Neither | 0 | 0 | 0 | 0 |
| 2 | 14 | Block_b_choiceSet_14_response | A | 0 | 2 | -1 | -1 |
| 2 | 14 | Block_b_choiceSet_14_response | B | 1 | 85 | 1 | 1 |
| 2 | 14 | Block_b_choiceSet_14_response | Neither | 0 | 0 | 0 | 0 |
| 2 | 18 | Block_b_choiceSet_18_response | A | 1 | 2 | 1 | 1 |
| 2 | 18 | Block_b_choiceSet_18_response | B | 0 | 0.2 | -1 | -1 |
| 2 | 18 | Block_b_choiceSet_18_response | Neither | 0 | 0 | 0 | 0 |
| 2 | 22 | Block_b_choiceSet_22_response | A | 0 | 2 | -1 | -1 |
| 2 | 22 | Block_b_choiceSet_22_response | B | 1 | 0.2 | 1 | 1 |
| 2 | 22 | Block_b_choiceSet_22_response | Neither | 0 | 0 | 0 | 0 |


Comment