Dear all,
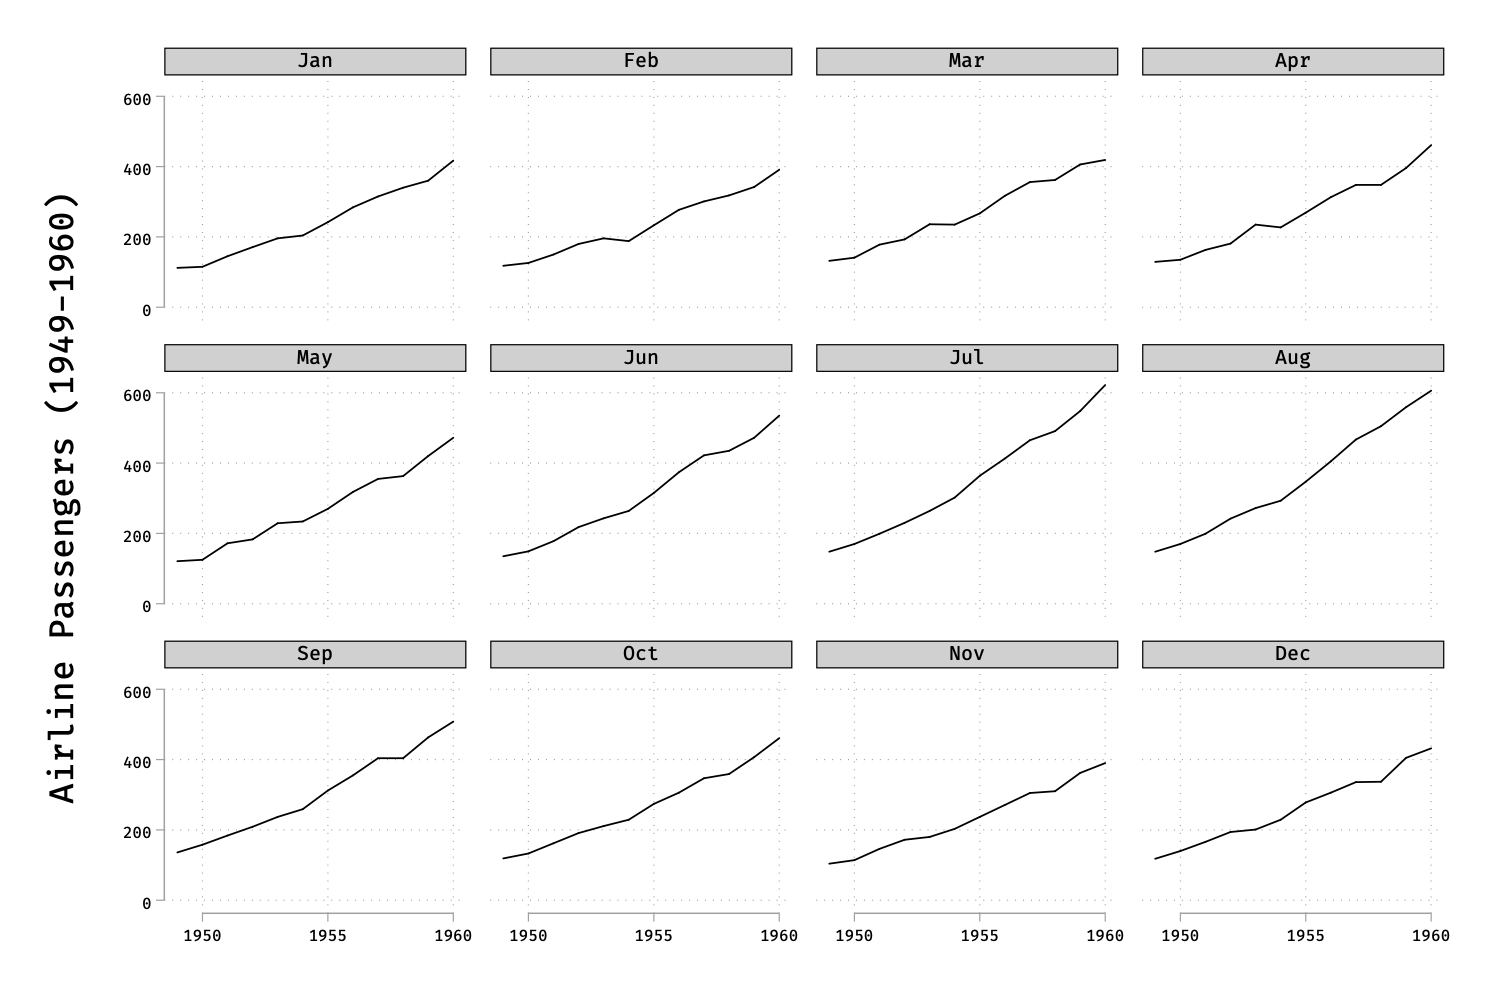
I have a dataset that includes 23 firms with their short volume values for 90 days. I need to present these values in line figures, with each firm's data displayed separately in a suitable size and layout. For example, I would like to group every 8 firms (8 figures) on one page, similar to the attached example layout. Could you please advise on how to achieve this?
Thank you.
************************************************** **********************
************************************************** ************************************************** ********************************
https://aliquote.org/img/stata-plot-002a.png

I have a dataset that includes 23 firms with their short volume values for 90 days. I need to present these values in line figures, with each firm's data displayed separately in a suitable size and layout. For example, I would like to group every 8 firms (8 figures) on one page, similar to the attached example layout. Could you please advise on how to achieve this?
Thank you.
************************************************** **********************
Code:
* Example generated by -dataex-. For more info, type help dataex
clear
input str4 Symbol byte Day double ShortVolume
"ABIO"  1 42.885073104386265
"ABIO"  2 53.396879043117785
"ABIO"  3  36.59576935181964
"ABIO"  4 45.232730631437526
"ABIO"  5 62.012860874807416
"ABIO"  6 61.938216343162246
"ABIO"  7  65.36631529139612
"ABIO"  8  64.36264721143414
"ABIO"  9 57.420812856476665
"ABIO" 10 28.614001679361845
"ABIO" 11  9.653579242926499
"ABIO" 12 50.046477040342076
"ABIO" 13 60.313763720392835
"ABIO" 14 54.479158083085146
"ABIO" 15  47.34487594912221
"ABIO" 16  55.58066139139185
"ABIO" 17  40.63314064554544
"ABIO" 18   61.6198471319945
"ABIO" 19   64.9673352643231
"ABIO" 20  46.54517096749264
"ABIO" 21  40.07216992584861
"ABIO" 22   69.1079706916038
"ABIO" 23 58.927314799314615
"ABIO" 24 22.280887011615626
"ABIO" 25 15.975564605701592
"ABIO" 26 53.553530751708436
"ABIO" 27 63.275109170305676
"ABIO" 28 14.209723310378951
"ABIO" 29  68.45539689851067
"ABIO" 30 30.107526881720432
"ABIO" 31 22.767423185833227
"ABIO" 32 22.559716897670302
"ABIO" 33   67.2884479092842
"ABIO" 34  5.692396092702547
"ABIO" 35  44.11425051967049
"ABIO" 36  87.65651120739653
"ABIO" 37 26.973026973026975
"ABIO" 38  39.99077136045528
"ABIO" 39  33.07976283700638
"ABIO" 40  7.104450291728635
"ABIO" 41  40.45404540454046
"ABIO" 42 11.278519156263453
"ABIO" 43   82.7527155298953
"ABIO" 44 21.595313980532346
"ABIO" 45  35.31501657981999
"ABIO" 46  59.59571358986848
"ABIO" 47 46.900146305779074
"ABIO" 48  36.56673511293634
"ABIO" 49  10.96433289299868
"ABIO" 50 3.2791327913279136
"ABIO" 51  66.13495524443425
"ABIO" 52 23.995713311466893
"ABIO" 53  40.95413689790274
"ABIO" 54  28.14309510589355
"ABIO" 55  64.15871233389481
"ABIO" 56 37.543388198410035
"ABIO" 57  31.46987951807229
"ABIO" 58 22.774433200973483
"ABIO" 59 20.968159461558376
"ABIO" 60   48.1372636328554
"ABIO" 61  48.52251407129456
"ABIO" 62  25.14602062065113
"ABIO" 63   7.07395498392283
"ABIO" 64  7.212402636309168
"ABIO" 65  20.13472055488862
"ABIO" 66 60.870005741497515
"ABIO" 67 22.316684378320936
"ABIO" 68 20.278776978417266
"ABIO" 69  43.92181294291722
"ABIO" 70  69.03334132885584
"ABIO" 71 13.821456538762725
"ABIO" 72  46.55145160440487
"ABIO" 73 18.207836456558773
"ABIO" 74  66.27314588027824
"ABIO" 75  60.00113327289212
"ABIO" 76 19.457511760584527
"ABIO" 77  42.94003868471953
"ABIO" 78  6.746727836999056
"ABIO" 79  53.44162769710395
"ABIO" 80  39.70605187319885
"ABIO" 81  51.90510962571852
"ABIO" 82  32.01936376210235
"ABIO" 83 3.3119921201674467
"ABIO" 84 21.967737963305012
"ABIO" 85  24.66429260330885
"ABIO" 86  26.16863644381725
"ABIO" 87  19.64480024871755
"ABIO" 88   28.4585475981437
"ABIO" 89    37.676419765972
"ABIO" 90             24.199
"ABVC"  1  51.81062682061924
"ABVC"  2 39.532457970303106
"ABVC"  3 40.310403003625225
"ABVC"  4 47.557591635713834
"ABVC"  5 49.149436200585775
"ABVC"  6 55.943864310453066
"ABVC"  7 53.983475637962385
"ABVC"  8  54.46493970308738
"ABVC"  9  57.04302849149043
"ABVC" 10 37.914712502952334
end
https://aliquote.org/img/stata-plot-002a.png


Comment