Announcement

Collapse
No announcement yet.
X
  • Filter
  • Time
  • Show
Clear All
new posts

  • line figures

    Dear all,

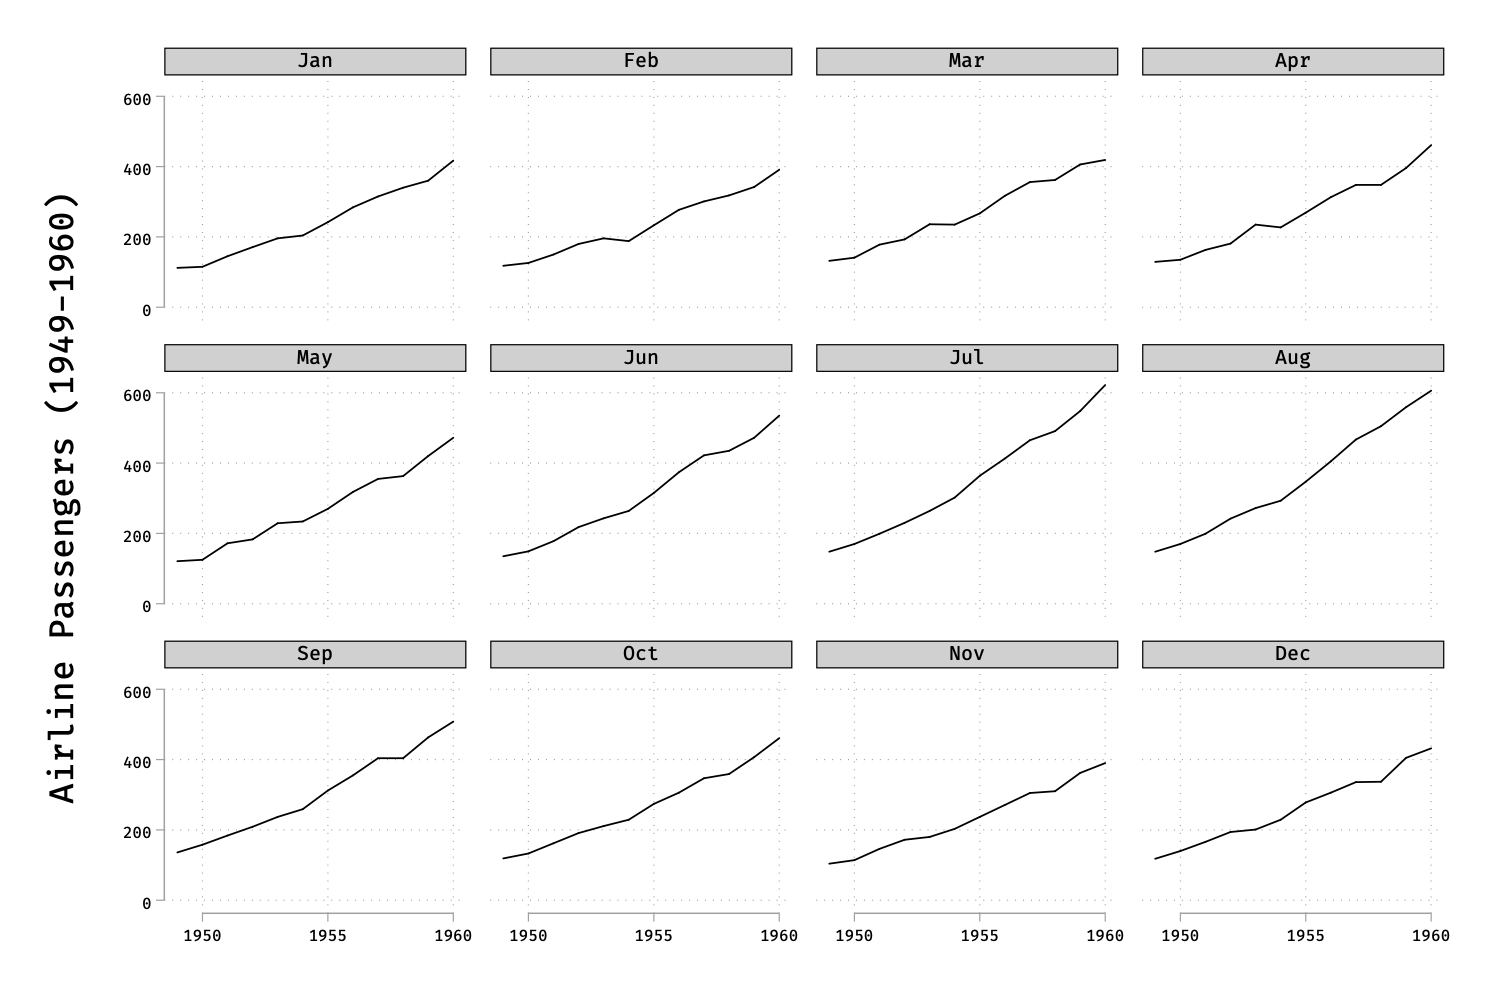
    I have a dataset that includes 23 firms with their short volume values for 90 days. I need to present these values in line figures, with each firm's data displayed separately in a suitable size and layout. For example, I would like to group every 8 firms (8 figures) on one page, similar to the attached example layout. Could you please advise on how to achieve this?

    Thank you.
    ************************************************** **********************
    Code:
    * Example generated by -dataex-. For more info, type help dataex
    clear
    input str4 Symbol byte Day double ShortVolume
    "ABIO"  1 42.885073104386265
    "ABIO"  2 53.396879043117785
    "ABIO"  3  36.59576935181964
    "ABIO"  4 45.232730631437526
    "ABIO"  5 62.012860874807416
    "ABIO"  6 61.938216343162246
    "ABIO"  7  65.36631529139612
    "ABIO"  8  64.36264721143414
    "ABIO"  9 57.420812856476665
    "ABIO" 10 28.614001679361845
    "ABIO" 11  9.653579242926499
    "ABIO" 12 50.046477040342076
    "ABIO" 13 60.313763720392835
    "ABIO" 14 54.479158083085146
    "ABIO" 15  47.34487594912221
    "ABIO" 16  55.58066139139185
    "ABIO" 17  40.63314064554544
    "ABIO" 18   61.6198471319945
    "ABIO" 19   64.9673352643231
    "ABIO" 20  46.54517096749264
    "ABIO" 21  40.07216992584861
    "ABIO" 22   69.1079706916038
    "ABIO" 23 58.927314799314615
    "ABIO" 24 22.280887011615626
    "ABIO" 25 15.975564605701592
    "ABIO" 26 53.553530751708436
    "ABIO" 27 63.275109170305676
    "ABIO" 28 14.209723310378951
    "ABIO" 29  68.45539689851067
    "ABIO" 30 30.107526881720432
    "ABIO" 31 22.767423185833227
    "ABIO" 32 22.559716897670302
    "ABIO" 33   67.2884479092842
    "ABIO" 34  5.692396092702547
    "ABIO" 35  44.11425051967049
    "ABIO" 36  87.65651120739653
    "ABIO" 37 26.973026973026975
    "ABIO" 38  39.99077136045528
    "ABIO" 39  33.07976283700638
    "ABIO" 40  7.104450291728635
    "ABIO" 41  40.45404540454046
    "ABIO" 42 11.278519156263453
    "ABIO" 43   82.7527155298953
    "ABIO" 44 21.595313980532346
    "ABIO" 45  35.31501657981999
    "ABIO" 46  59.59571358986848
    "ABIO" 47 46.900146305779074
    "ABIO" 48  36.56673511293634
    "ABIO" 49  10.96433289299868
    "ABIO" 50 3.2791327913279136
    "ABIO" 51  66.13495524443425
    "ABIO" 52 23.995713311466893
    "ABIO" 53  40.95413689790274
    "ABIO" 54  28.14309510589355
    "ABIO" 55  64.15871233389481
    "ABIO" 56 37.543388198410035
    "ABIO" 57  31.46987951807229
    "ABIO" 58 22.774433200973483
    "ABIO" 59 20.968159461558376
    "ABIO" 60   48.1372636328554
    "ABIO" 61  48.52251407129456
    "ABIO" 62  25.14602062065113
    "ABIO" 63   7.07395498392283
    "ABIO" 64  7.212402636309168
    "ABIO" 65  20.13472055488862
    "ABIO" 66 60.870005741497515
    "ABIO" 67 22.316684378320936
    "ABIO" 68 20.278776978417266
    "ABIO" 69  43.92181294291722
    "ABIO" 70  69.03334132885584
    "ABIO" 71 13.821456538762725
    "ABIO" 72  46.55145160440487
    "ABIO" 73 18.207836456558773
    "ABIO" 74  66.27314588027824
    "ABIO" 75  60.00113327289212
    "ABIO" 76 19.457511760584527
    "ABIO" 77  42.94003868471953
    "ABIO" 78  6.746727836999056
    "ABIO" 79  53.44162769710395
    "ABIO" 80  39.70605187319885
    "ABIO" 81  51.90510962571852
    "ABIO" 82  32.01936376210235
    "ABIO" 83 3.3119921201674467
    "ABIO" 84 21.967737963305012
    "ABIO" 85  24.66429260330885
    "ABIO" 86  26.16863644381725
    "ABIO" 87  19.64480024871755
    "ABIO" 88   28.4585475981437
    "ABIO" 89    37.676419765972
    "ABIO" 90             24.199
    "ABVC"  1  51.81062682061924
    "ABVC"  2 39.532457970303106
    "ABVC"  3 40.310403003625225
    "ABVC"  4 47.557591635713834
    "ABVC"  5 49.149436200585775
    "ABVC"  6 55.943864310453066
    "ABVC"  7 53.983475637962385
    "ABVC"  8  54.46493970308738
    "ABVC"  9  57.04302849149043
    "ABVC" 10 37.914712502952334
    end
    ************************************************** ************************************************** ********************************
    https://aliquote.org/img/stata-plot-002a.png

  • #2
    Nick Cox Andrew Musau Joseph Coveney

    Comment


    • #3
      Code:
      encode Symbol, gen(firm)
      xtset firm Day
      xtline ShortVolume if inrange(firm, 1, 8)
      xtline ShortVolume if inrange(firm, 9, 16)
      and so on. See

      Code:
      help xtline

      Comment


      • #4
        Thank you very much, Andrew Musau It works perfectly. I have another question, if you don't mind. Since I have 90 days for each firm and on the same figures and layout, can I add another line in the figure for each firm that represents the average short volume for the last 30 days? Many thanks.

        Comment


        • #5
          Use rangestat from SSC to create a variable with the rolling average and then add these lines using the -addplot()- option. Using part of the Grunfeld dataset and assuming averages over the entire sample period:

          Code:
          webuse grunfeld, clear
          xtset company year
          bys company: egen meanmv= mean(mvalue)
          keep if company<=4
          xtline mvalue, addplot(line meanmv year, sort) xtitle("") byopts(leg(off) note(""))
          Click image for larger version

Name:	Graph.png
Views:	1
Size:	53.8 KB
ID:	1753045

          Last edited by Andrew Musau; 12 May 2024, 05:19.

          Comment


          • #6
            Thank you so much Andrew Musau

            Comment


            • #7
              Dear Andrew Musau
              I apologize for asking several questions. I need to make modifications to the chart and ask one more question. First, when I use the command 'xtline Shortvolume if inrange(firm, 1, 4), addplot(line meanmv Day, sort) xtitle("") byopts(leg(off) note("")),' it displays firms 1 to 4 perfectly on one page, but it also shows charts for the remaining firms (5 to 23) with only their mean lines. I attempted this adjustment: 'xtline Shortvolume, addplot(line meanmv Day, sort) if inrange(firm, 1, 4) xtitle("") byopts(leg(off) note("")), but it didn't work.

              Secondly, how can I modify the above code to assign each firm chart its own Y-axis? Additionally, I want to change the Y and X-axis values from (0, 50, 100) to (0, 20, 40, 60, 80, 100) for some and replace the numbers with dashes for others (10, 30, 50, 70, 90). Thank you so much.

              Comment


              • #8


                Your first problem arises because you didn't follow Andrew Musau's code which solves that difficulty with a keep statement.

                Code:
                webuse grunfeld, clear
                xtset company year
                bys company: egen meanmv= mean(mvalue)
                keep if company<=4
                xtline mvalue, addplot(line meanmv year, sort) xtitle("") byopts(leg(off) yrescale note(""))

                Above I've added yrescale, but your second request contradicts itself as asking for separate y scales doesn't seem consistent with specifying 0(20)100 as y axis labels.


                Otherwise (setting aside complications we don't need here) an if qualifier should be put before the options, not after or among them.


                This may be closer to what you want.


                Code:
                xtline Shortvolume if inrange(firm, 1, 4), addplot(line meanmv Day if inrange(firm, 1, 4), sort) xtitle("") byopts(leg(off) yrescale note(""))

                Comment


                • #9
                  Dear Nick Cox ,

                  Thank you for your assistance. I tried the code you provided, and it produced a layout where the y-axis labels are not consistent even though I specified them as 0(20)100. How can I make them consistent?

                  Regarding my second question, I used the following code:
                  xtline Shortvolume if inrange(firm, 1, 4), addplot(line meanmv Day if inrange(firm, 1, 4), sort) xtitle("") byopts(leg(off) yrescale note(""))

                  This code displays firms 1 to 4 perfectly on one page, but it also shows charts for the remaining firms (5 to 23) as empty. I tried using the code that Andrew Musau suggested, which is keep if firm<=4, and it works well as shown in the picture. However, it seems a bit complicated since I want to create charts for the remaining firms that were already deleted. Can you suggest a simpler way to achieve this? Thank you for your help.

                  Comment


                  • #10
                    efeClick image for larger version

Name:	Graph.jpg
Views:	2
Size:	54.4 KB
ID:	1753160
                    Click image for larger version

Name:	Graph.jpg
Views:	2
Size:	54.4 KB
ID:	1753159
                    Last edited by Bashar Fin; 13 May 2024, 07:12. Reason: Chart

                    Comment


                    • #11
                      #9

                      I tried the code you provided, and it produced a layout where the y-axis labels are not consistent even though I specified them as 0(20)100. How can I make them consistent

                      was already explained in #8

                      your second request contradicts itself as asking for separate y scales doesn't seem consistent with specifying 0(20)100 as y axis labels.
                      You can easily make them consistent. yla(0(20)100) will do that. But now don't specify yrescale.


                      I want to create charts for the remaining firms that were already deleted. Can you suggest a simpler way to achieve this?
                      This also is already explained. Use an if qualifier on each graph call.

                      Comment


                      • #12
                        Many Thanks. Well, I tried this and gave me this error :
                        xtline Shortvolume if inrange(firm, 1, 4), addplot(line meanmv Day if inrange(firm, 1, 4), sort) ytitle("Short Volume") xtitle("Day") byopts(leg(off) yla((0(20)100))
                        ) required
                        r(100);

                        Comment


                        • #13
                          Code:
                          byopts(leg(off) yla((0(20)100))
                          has 5 ( and 4 ).

                          You need I think

                          Code:
                          byopts(leg(off)) yla(0(20)100)
                          Sometimes you just need to count what you're written down.

                          Comment


                          • #14
                            Thank you do much Nick Cox

                            Comment


                            • #15
                              Dear Nick Cox and Andrew Musau , I apologize for posing multiple questions. While attempting to make slight adjustments to my charts, I encountered issues running several codes like these:

                              twoway area Shortvolume Day if inrange(Firm, 1, 9), color(gray) addplot(line FivesShort Day if inrange(firm, 1, 9) by( Firm , yrescale) yscale(range(0 (20) 100 )) ylabel(#5) x scale(range(0 (20) 100 )) xlabel(#5) ytitle("Short Volume") xtitle("DAY") by(Symbol ).

                              twoway area Shortvolume Day if inrange(Firm, 1, 9), color(gray)|| addplot line FivesShort Day if inrange(firm, 1, 9), sort) by( Firm , yrescale) yscale(range(0 (20) 100 )) ylab el(#5) xscale(range(0 (20) 100 )) xlabel(#5) ytitle("Short Volume") xtitle("DAY") by(Symbol )


                              I aim to incorporate a red line depicting the 'FivesShort' within this area, similar to the attached picture, but I'm unsure how to proceed. Any assistance would be greatly appreciated. Thank you in advance
                              Click image for larger version

Name:	Stata .jpg
Views:	1
Size:	326.0 KB
ID:	1753263

                              Comment

                              Working...
                              X