I am using the `rforest' package in Stata, and would like to generate the SHAP values to understand the contribution of a feature/variable on the prediction. This can be done in Python using SHAP package (https://shap.readthedocs.io/en/latest/), or in R using its R wrapper (https://modeloriented.github.io/shapper/).
However, I need to do this in Stata. Any suggestions on existing packages that can implement a SHAP summary plot in Stata? My goal is to create a SHAP summary plot like the one below.
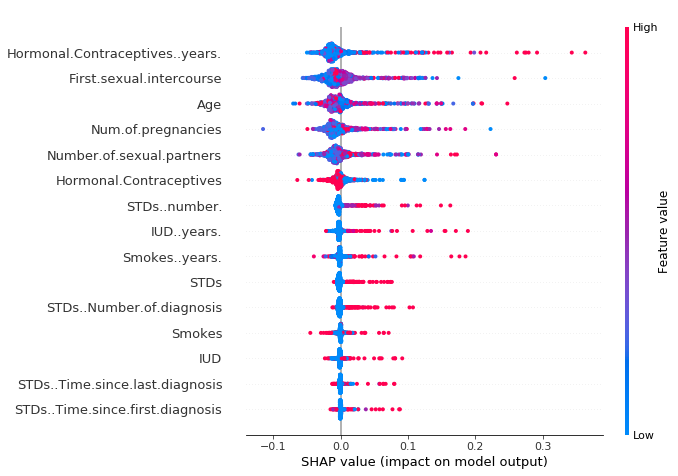
However, I need to do this in Stata. Any suggestions on existing packages that can implement a SHAP summary plot in Stata? My goal is to create a SHAP summary plot like the one below.
Comment