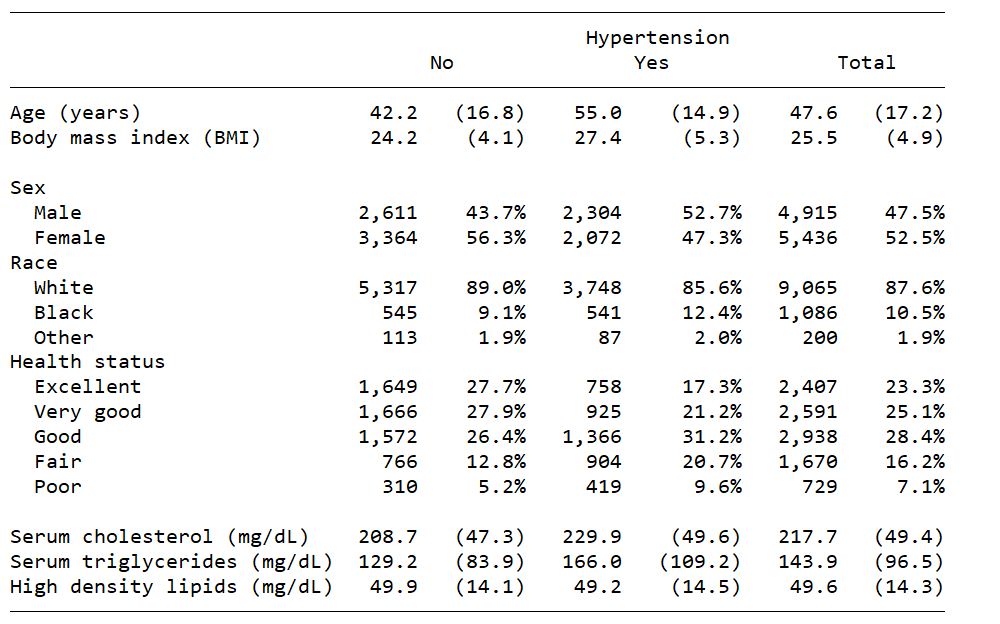
Hi, I would like to create a table similar to the following:
I tried to follow the steps found on here (https://blog.stata.com/2021/06/07/cu...table-command/). However, my attempt resulted for the characteristics to be further split for example showing the male and their age as shown here.
. table Gender Health delta2017
------------------------------------
| delta2017
| 0 1 Total
----------------+-------------------
Gender |
male |
Health |
very good | 50 153 203
good | 64 181 245
fair | 14 31 45
bad | 4 5 9
very bad | 1 1
Total | 132 371 503
female |
Health |
very good | 42 113 155
good | 55 111 166
fair | 12 20 32
bad | 2 2
very bad | 1 1 2
Total | 110 247 357
Total |
Health |
very good | 92 266 358
good | 119 292 411
fair | 26 51 77
bad | 4 7 11
very bad | 1 2 3
Total | 242 618 860
------------------------------------
.
Whereas all I want are the gender separate and the Health status separate similar to the screenshot.
Thanks in advance.
Kylie
Comment