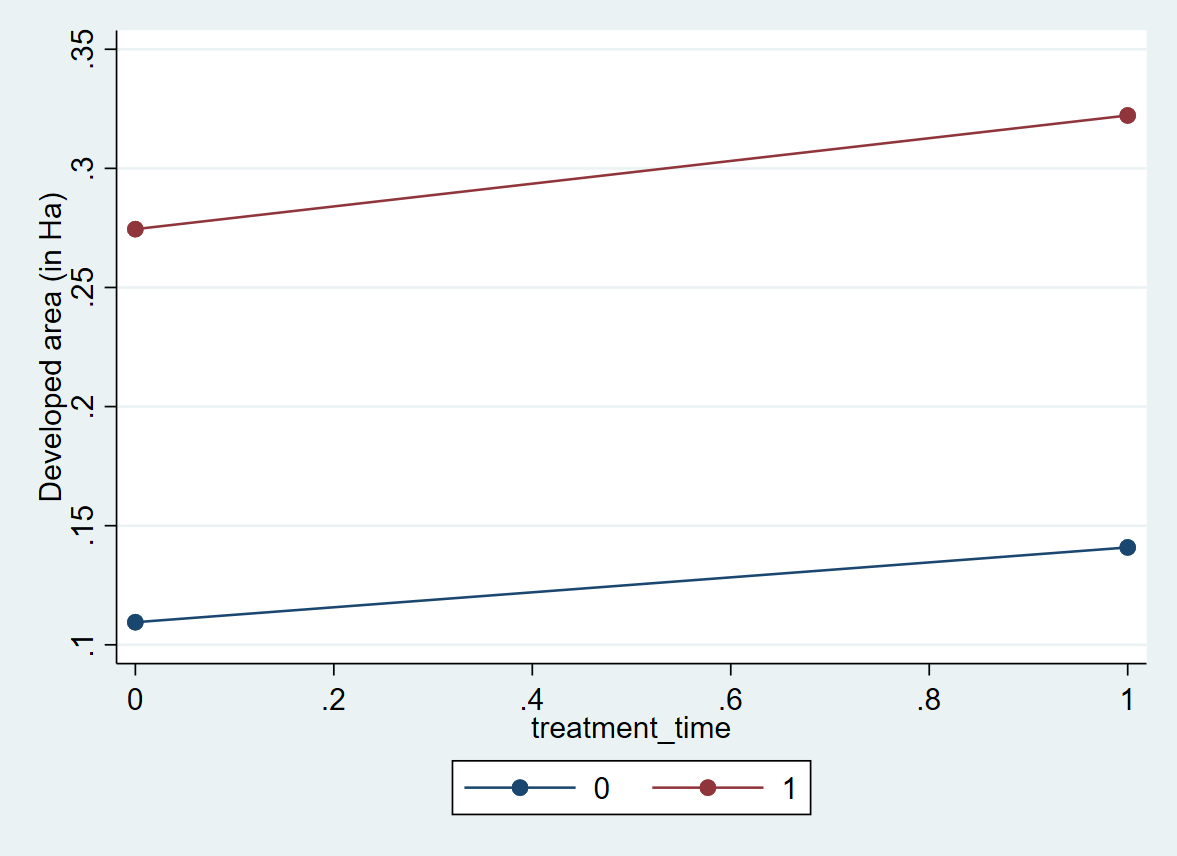
I am trying to visualize treatment effects over time or time since treatment. This is because I expect that the treatment I am evaluating, which is a tax policy, to take time before it materializes once it's implemented.
The outcome variable here is the area of developed land, before and after the policy and across treatment vs. control cities. However, I would like to visualize treatment effects throughout time, rather than merely before and after implementation. Specifically, the policy imposes a higher tax rate on undeveloped properties in urban areas, so I expect that it took time from the implementation date before landowners can develop their lands.
Here is a dataex:
```
dataex area_dev treated_neighborhood treatment_time month
input double area_dev float(treated_neighborhood treatment_time month)
.0591989990234375 1 0 17
.4761 1 0 33
.576941000366211 1 1 46
.0414 1 1 79
.0396 1 1 86
.06 1 1 46
1.1666919982910156 1 0 27
.0031319999694824218 1 1 81
.0375 1 1 70
.18189000091552734 1 0 31
.1 1 1 41
.1492739990234375 1 0 18
.06 1 0 5
.08646499938964844 1 0 28
.02205 1 0 26
.032522000122070314 1 1 44
.2321780014038086 1 0 16
```
Upload Diff in Diff package and running the model:
```
ssc install diff
// Visualization packages
ssc install coefplot, replace
ssc install lgraph
diff area_dev, t(treated_neighborhood) p(treatment_time)
```
Here is the code to generate my coefficient plot:
```
// Creating coefficient plots
coefplot implementation announcement, xline(0) drop(_cons treated_neighborhood treatment_time announcement_time)
```
 d
d
I tried the following code but not sure if it's visualizing treatment by time:
```
lgraph area_dev treatment_time, by(treated_neighborhood)
```

The outcome variable here is the area of developed land, before and after the policy and across treatment vs. control cities. However, I would like to visualize treatment effects throughout time, rather than merely before and after implementation. Specifically, the policy imposes a higher tax rate on undeveloped properties in urban areas, so I expect that it took time from the implementation date before landowners can develop their lands.
Here is a dataex:
```
dataex area_dev treated_neighborhood treatment_time month
input double area_dev float(treated_neighborhood treatment_time month)
.0591989990234375 1 0 17
.4761 1 0 33
.576941000366211 1 1 46
.0414 1 1 79
.0396 1 1 86
.06 1 1 46
1.1666919982910156 1 0 27
.0031319999694824218 1 1 81
.0375 1 1 70
.18189000091552734 1 0 31
.1 1 1 41
.1492739990234375 1 0 18
.06 1 0 5
.08646499938964844 1 0 28
.02205 1 0 26
.032522000122070314 1 1 44
.2321780014038086 1 0 16
```
Upload Diff in Diff package and running the model:
```
ssc install diff
// Visualization packages
ssc install coefplot, replace
ssc install lgraph
diff area_dev, t(treated_neighborhood) p(treatment_time)
```
Here is the code to generate my coefficient plot:
```
// Creating coefficient plots
coefplot implementation announcement, xline(0) drop(_cons treated_neighborhood treatment_time announcement_time)
```
I tried the following code but not sure if it's visualizing treatment by time:
```
lgraph area_dev treatment_time, by(treated_neighborhood)
```

Comment