Hi folks, I have two separate single-group interrupted time-series graphs generated using the -itsa- command.
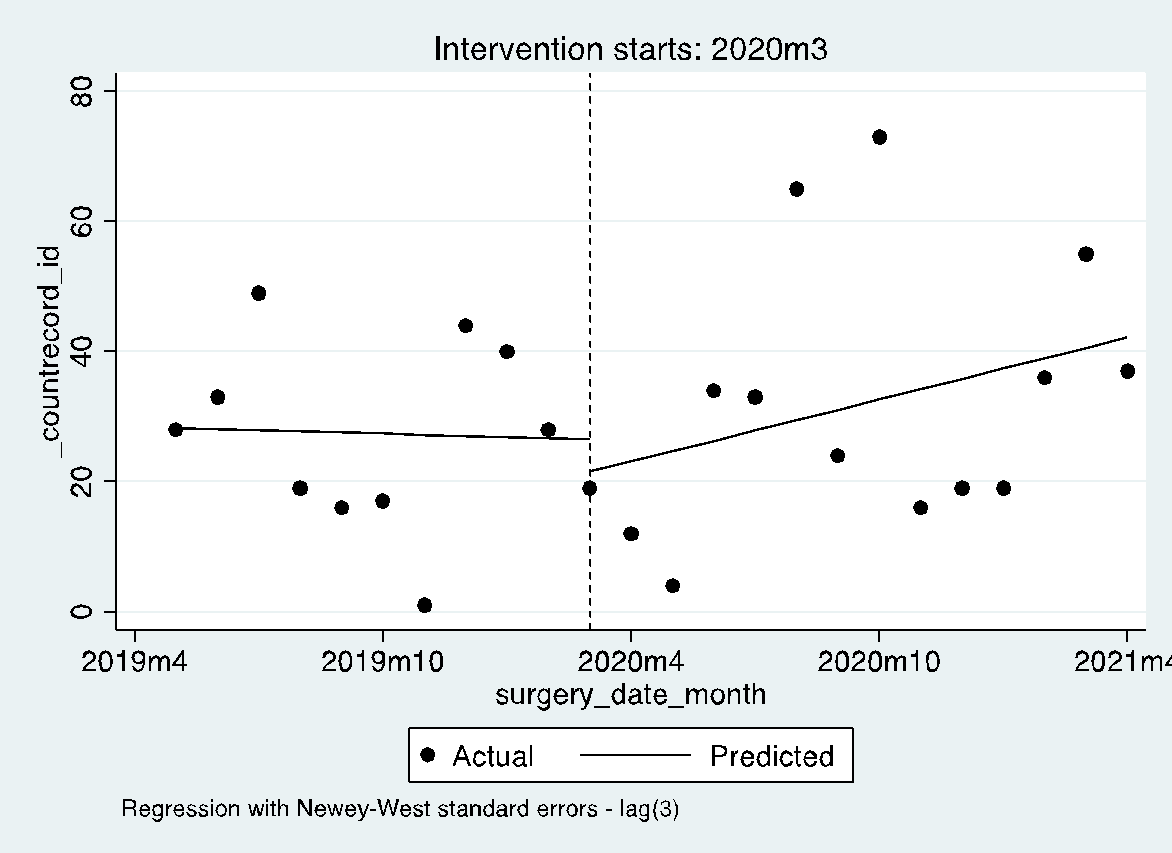
One looks at the change in emergency surgical volume and the other looks at the change in elective surgical volume due to an intervention implemented at the same time (see figures below):


How do I combine the two graphs to generate one figure with both graphs displayed in lines using different legends (e.g. one solid, other dashed)? The x- and y-axis are the same. I just need a way to display them together in a single figure to save space/reduce redundancy.
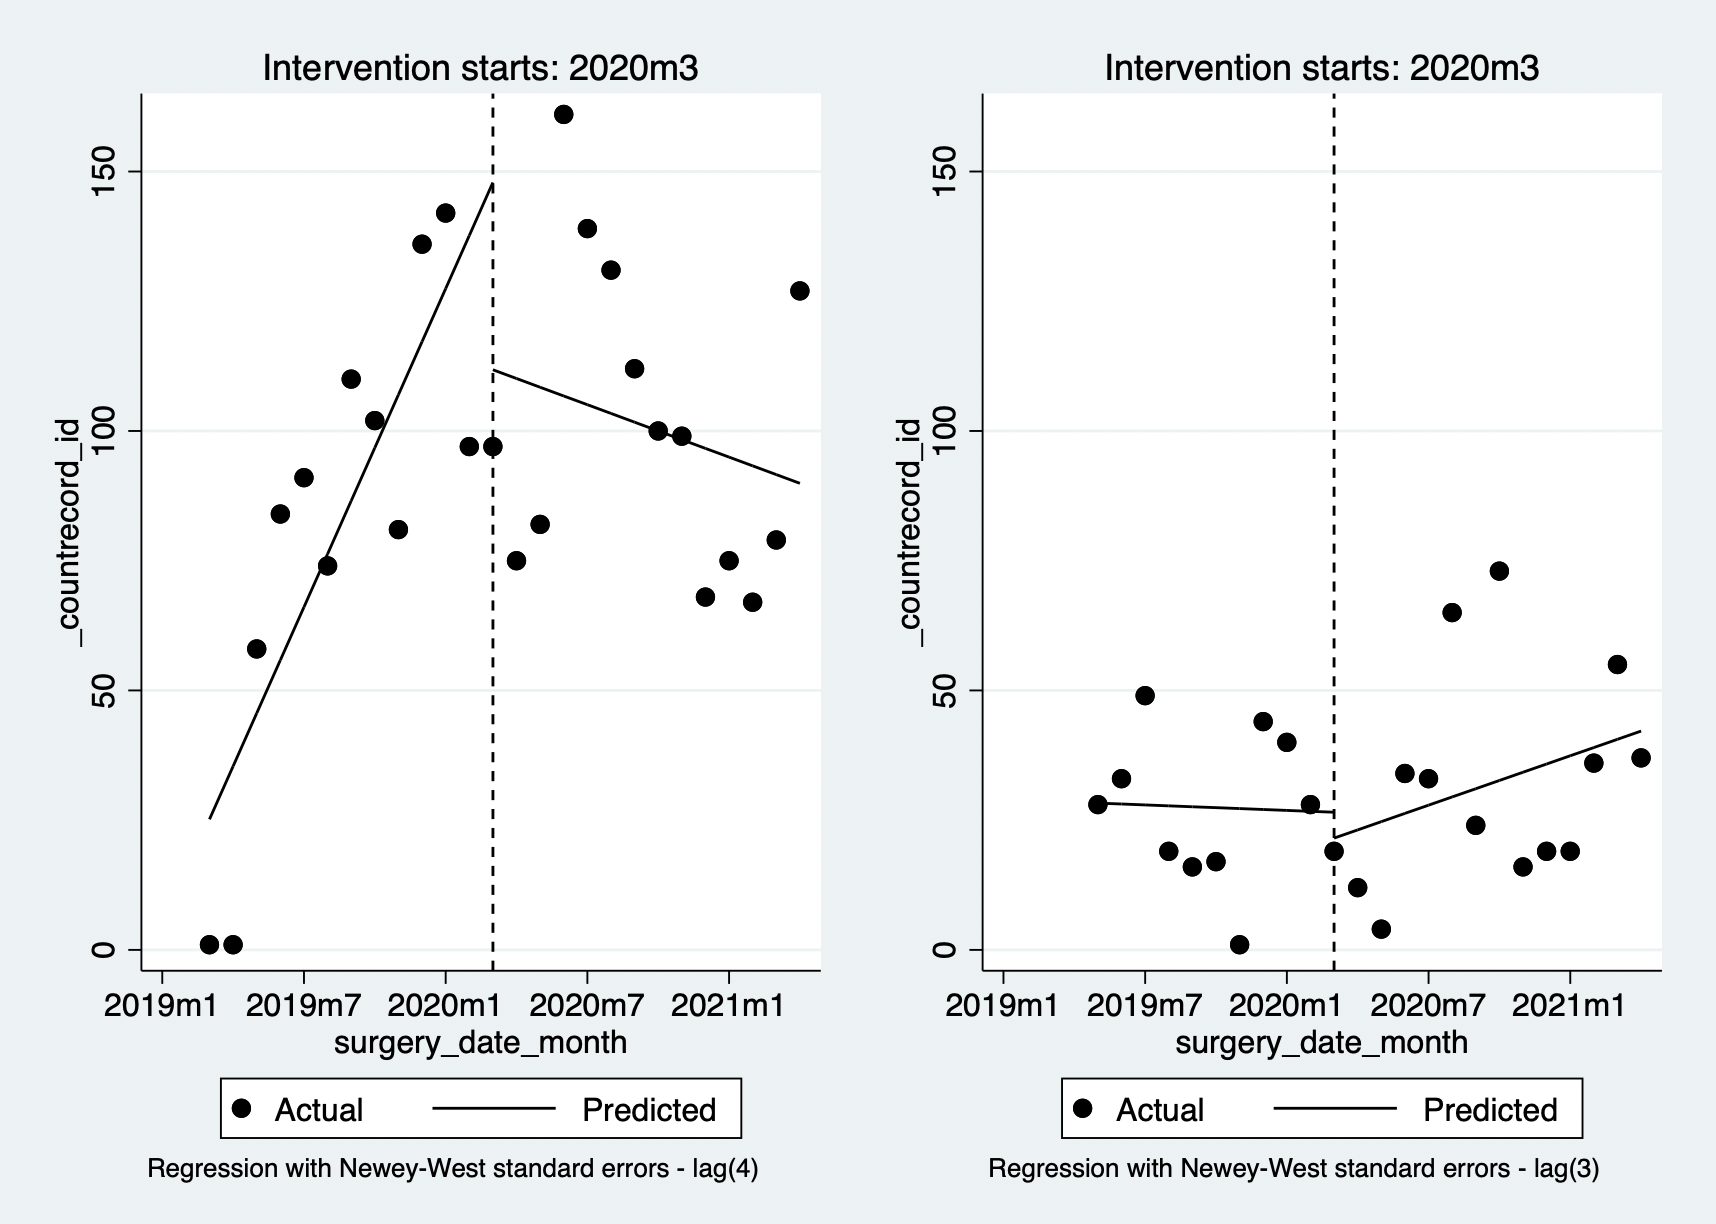
-graph combine- command seems to just produce figures with the two graphs next to each other, which is not what I am looking for:

Any help would be greatly appreciated!
One looks at the change in emergency surgical volume and the other looks at the change in elective surgical volume due to an intervention implemented at the same time (see figures below):
How do I combine the two graphs to generate one figure with both graphs displayed in lines using different legends (e.g. one solid, other dashed)? The x- and y-axis are the same. I just need a way to display them together in a single figure to save space/reduce redundancy.
-graph combine- command seems to just produce figures with the two graphs next to each other, which is not what I am looking for:
Any help would be greatly appreciated!

Comment