Announcement

Collapse
No announcement yet.
X
  • Filter
  • Time
  • Show
Clear All
new posts

  • Scatter plot troubles!


    Hi!
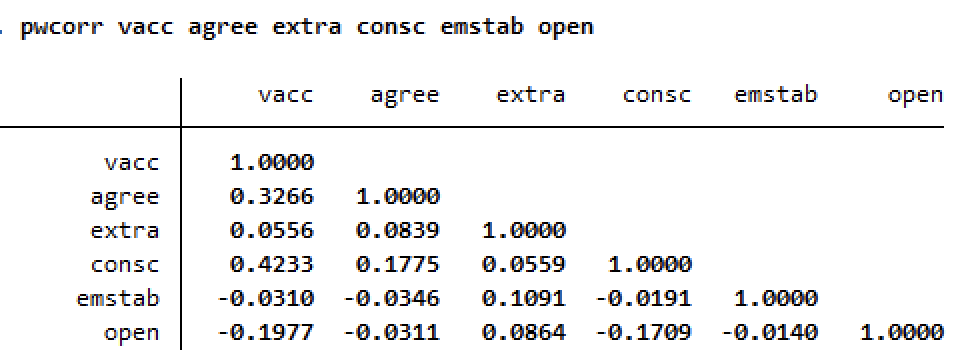
    I'm trying to analyse some statistics and was having trouble figuring out why my scatter plots are shown so unusually!. I have sent a correlation test with intention to vaccinate and the personality trait openness and its corresponding scatter plot when I put in the code "scatter vacc open". I tried to look it up online but have had no luck with what I should do.

    Hopefully this makes sense!


  • #2
    It seems that vacc has values 4 5 6 7 8 9 10 and open has values 1.5 3 3.5 4 4.5 5 5.6 6.6.5 7 and most of the possible pairs of values occur. Make sense?

    To get a better idea go for
    Code:
    scatter vacc open, ms(Oh) jitter(1)

    Comment


    • #3
      Okay! I understand now!. I'm just getting used to stata and statistics so I can get confused sometimes. Thankyou for clearing it all up!

      Comment

      Working...
      X