Announcement

Collapse
No announcement yet.
X
  • Filter
  • Time
  • Show
Clear All
new posts

  • A png file in a do file?

    Dear All, Is it possible to insert a png file into a regular do file? (Please ssc install cibar)
    Code:
    sysuse auto, clear
    cibar price, over1(foreign)
    In other words, I want to see the png file in the do file so that I know the (graph) output of the command before I run the code.
    Attached Files
    Ho-Chuan (River) Huang
    Stata 17.0, MP(4)

  • #2
    I'm afraid that's not possible. do-files can only contain plain text. Probably the closest you could come is including a comment that mentions the .png file.

    Comment


    • #3
      Dear Clyde, Thanks. I didn't expect that it can be done, either.
      Ho-Chuan (River) Huang
      Stata 17.0, MP(4)

      Comment


      • #4
        From section 16.1 of the Stata User's Guide PDF

        Rather than typing commands at the keyboard, you can create a text file containing commands and instruct Stata to execute the commands stored in that file. Such files are called do-files because the command that causes them to be executed is do.
        As a text file, then, the do-file cannot contain a PNG.

        Comment


        • #5
          Dear William, Got it and thanks.

          Ho-Chuan (River) Huang
          Stata 17.0, MP(4)

          Comment


          • #6
            River Huang,

            a number of responses above explained the impossibility of what you request from the technical standpoint that the do-file is a text file, and thus can't contain images.
            I wanted to add that your wish "I want to see the png file in the do file so that I know the (graph) output of the command before I run the code" is also not possible conceptually, since the output is the result of running the code.

            Depending on what you are doing recommendations may vary, but perhaps you can double-link (insert the output file name somewhere prominently at the top of the file, and include the name of the do file into a footnote in the chart, a la "generated with myprog.do" ), or have a convention of naming the output always as the name of the do file that has generated it.

            Best, Sergiy

            Comment


            • #7
              I interpreted the question a little more abstractly: I think the intent was to include a PNG containing an example of the sort of graph that running the code would produce.

              Comment


              • #8
                Even interpreting the request literally, contra William Lisowski, I think I know what is intended here. I sometimes have a project directory with many outputs and many do-files. While I am often careful to name the outputs and the do-files in a parallel fashion so I can keep track of which came from where, it isn't always possible, and sometimes I just am not careful enough. It would be nice if, once a do-file is run (or, actually, I would do this in the .smcl log file were it possible), an image of the graph were created in it. It would then make it easier, when I go back to it months later, to find the code that created that specific graph. (My usual approach in this situation is tedious: I have to scan all the candidate do files looking either for the -graph save/export- statement or for an informative comment in the code. An actual replica of the graph would probably make the process quicker and easier.)

                Comment


                • #9
                  The trouble is that a do-file may be parametrized and produce dozens (or thousands) of output charts, e.g. one for each year of survey, or each market, etc. Storing them all in the do file would be rather impractical.

                  I had anticipated both of these interpretations (William and Clyde's), plus also possibility of security sandbox, and other more exotic ones.
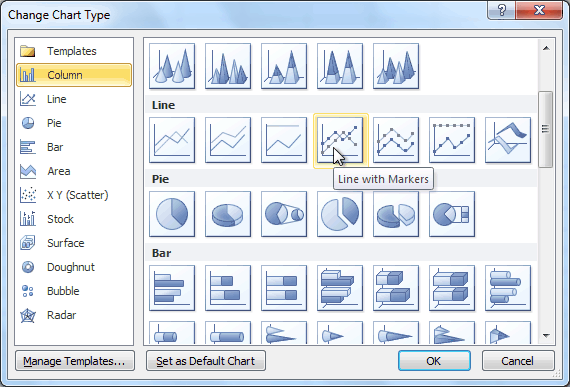
                  In Clyde's interpretation, adding a footnote or an index file should help, but if we take William's interpretation then I'd probably opt for packaging my do/ado-files in a menu driven system to provide a visual choice of graphs for the user, kind of what Excel does for its charts:

                  Comment


                  • #10
                    Dear all, Thanks again. William is right about my intent. I might take Clyde and Sergiy's suggestions into account.
                    Ho-Chuan (River) Huang
                    Stata 17.0, MP(4)

                    Comment

                    Working...
                    X