Hello all
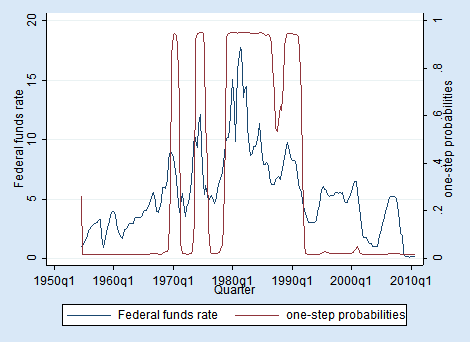
My apologies for the simple question, but I am an absolute beginner at Stata. I am trying to plot the predicted probabilities of an AR Markov Switching model together with the data. Basically I am trying to make a chart like the one in
https://www.stata.com/stata14/markov-switching-models/

Can someone please help?
My apologies for the simple question, but I am an absolute beginner at Stata. I am trying to plot the predicted probabilities of an AR Markov Switching model together with the data. Basically I am trying to make a chart like the one in
https://www.stata.com/stata14/markov-switching-models/

Can someone please help?

Comment