Hello all,
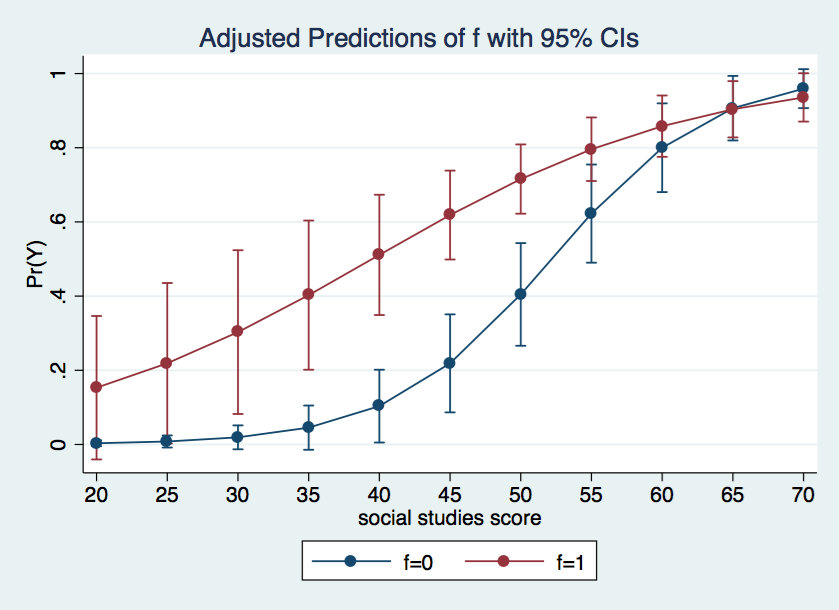
I am currently trying to find a way to add error bars to a two-way line graph but it has me completely stumped. I would like to produce something like the graph below, where the lines represent gender, the y-axis mean BMI, and the x-axis Age. Any ideas?? I have been trying different combinations for 2 days with no luck.
Thanks,
Sarah


Comment