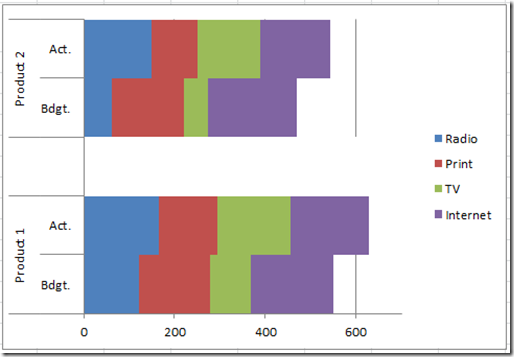
Well, I want to create a diagram, that is a mixture of these two:
http://www.stata.com/support/faqs/gr...ther-variable/ and http://www.stata.com/support/faqs/gr...art/index.html
I basically want a bar chart, that is stacked on one variable but has multiple columns in each "row". I attach a random picture from excel.

Assume using the auto dataset.
and now you have 2 graphs, one for foreign, one for abroad. And as mentioned above, I would wish to have both locations as 2 bars in one diagram (in the language of the picture above, i want one stacked bar domestic (as act.) and one stacked bar (as Bdgt.)).
Is there any way to do that in Stata?
Best and many thanks.
http://www.stata.com/support/faqs/gr...ther-variable/ and http://www.stata.com/support/faqs/gr...art/index.html
I basically want a bar chart, that is stacked on one variable but has multiple columns in each "row". I attach a random picture from excel.

Assume using the auto dataset.
Code:
sysuse auto, clear
 Graph hbar (sum) price, over(rep78)  over(gear_ratio)  by(foreign) asyvars   stack
Is there any way to do that in Stata?
Best and many thanks.

Comment