Announcement

Collapse
No announcement yet.
X
  • Filter
  • Time
  • Show
Clear All
new posts

  • brewscheme release candidate

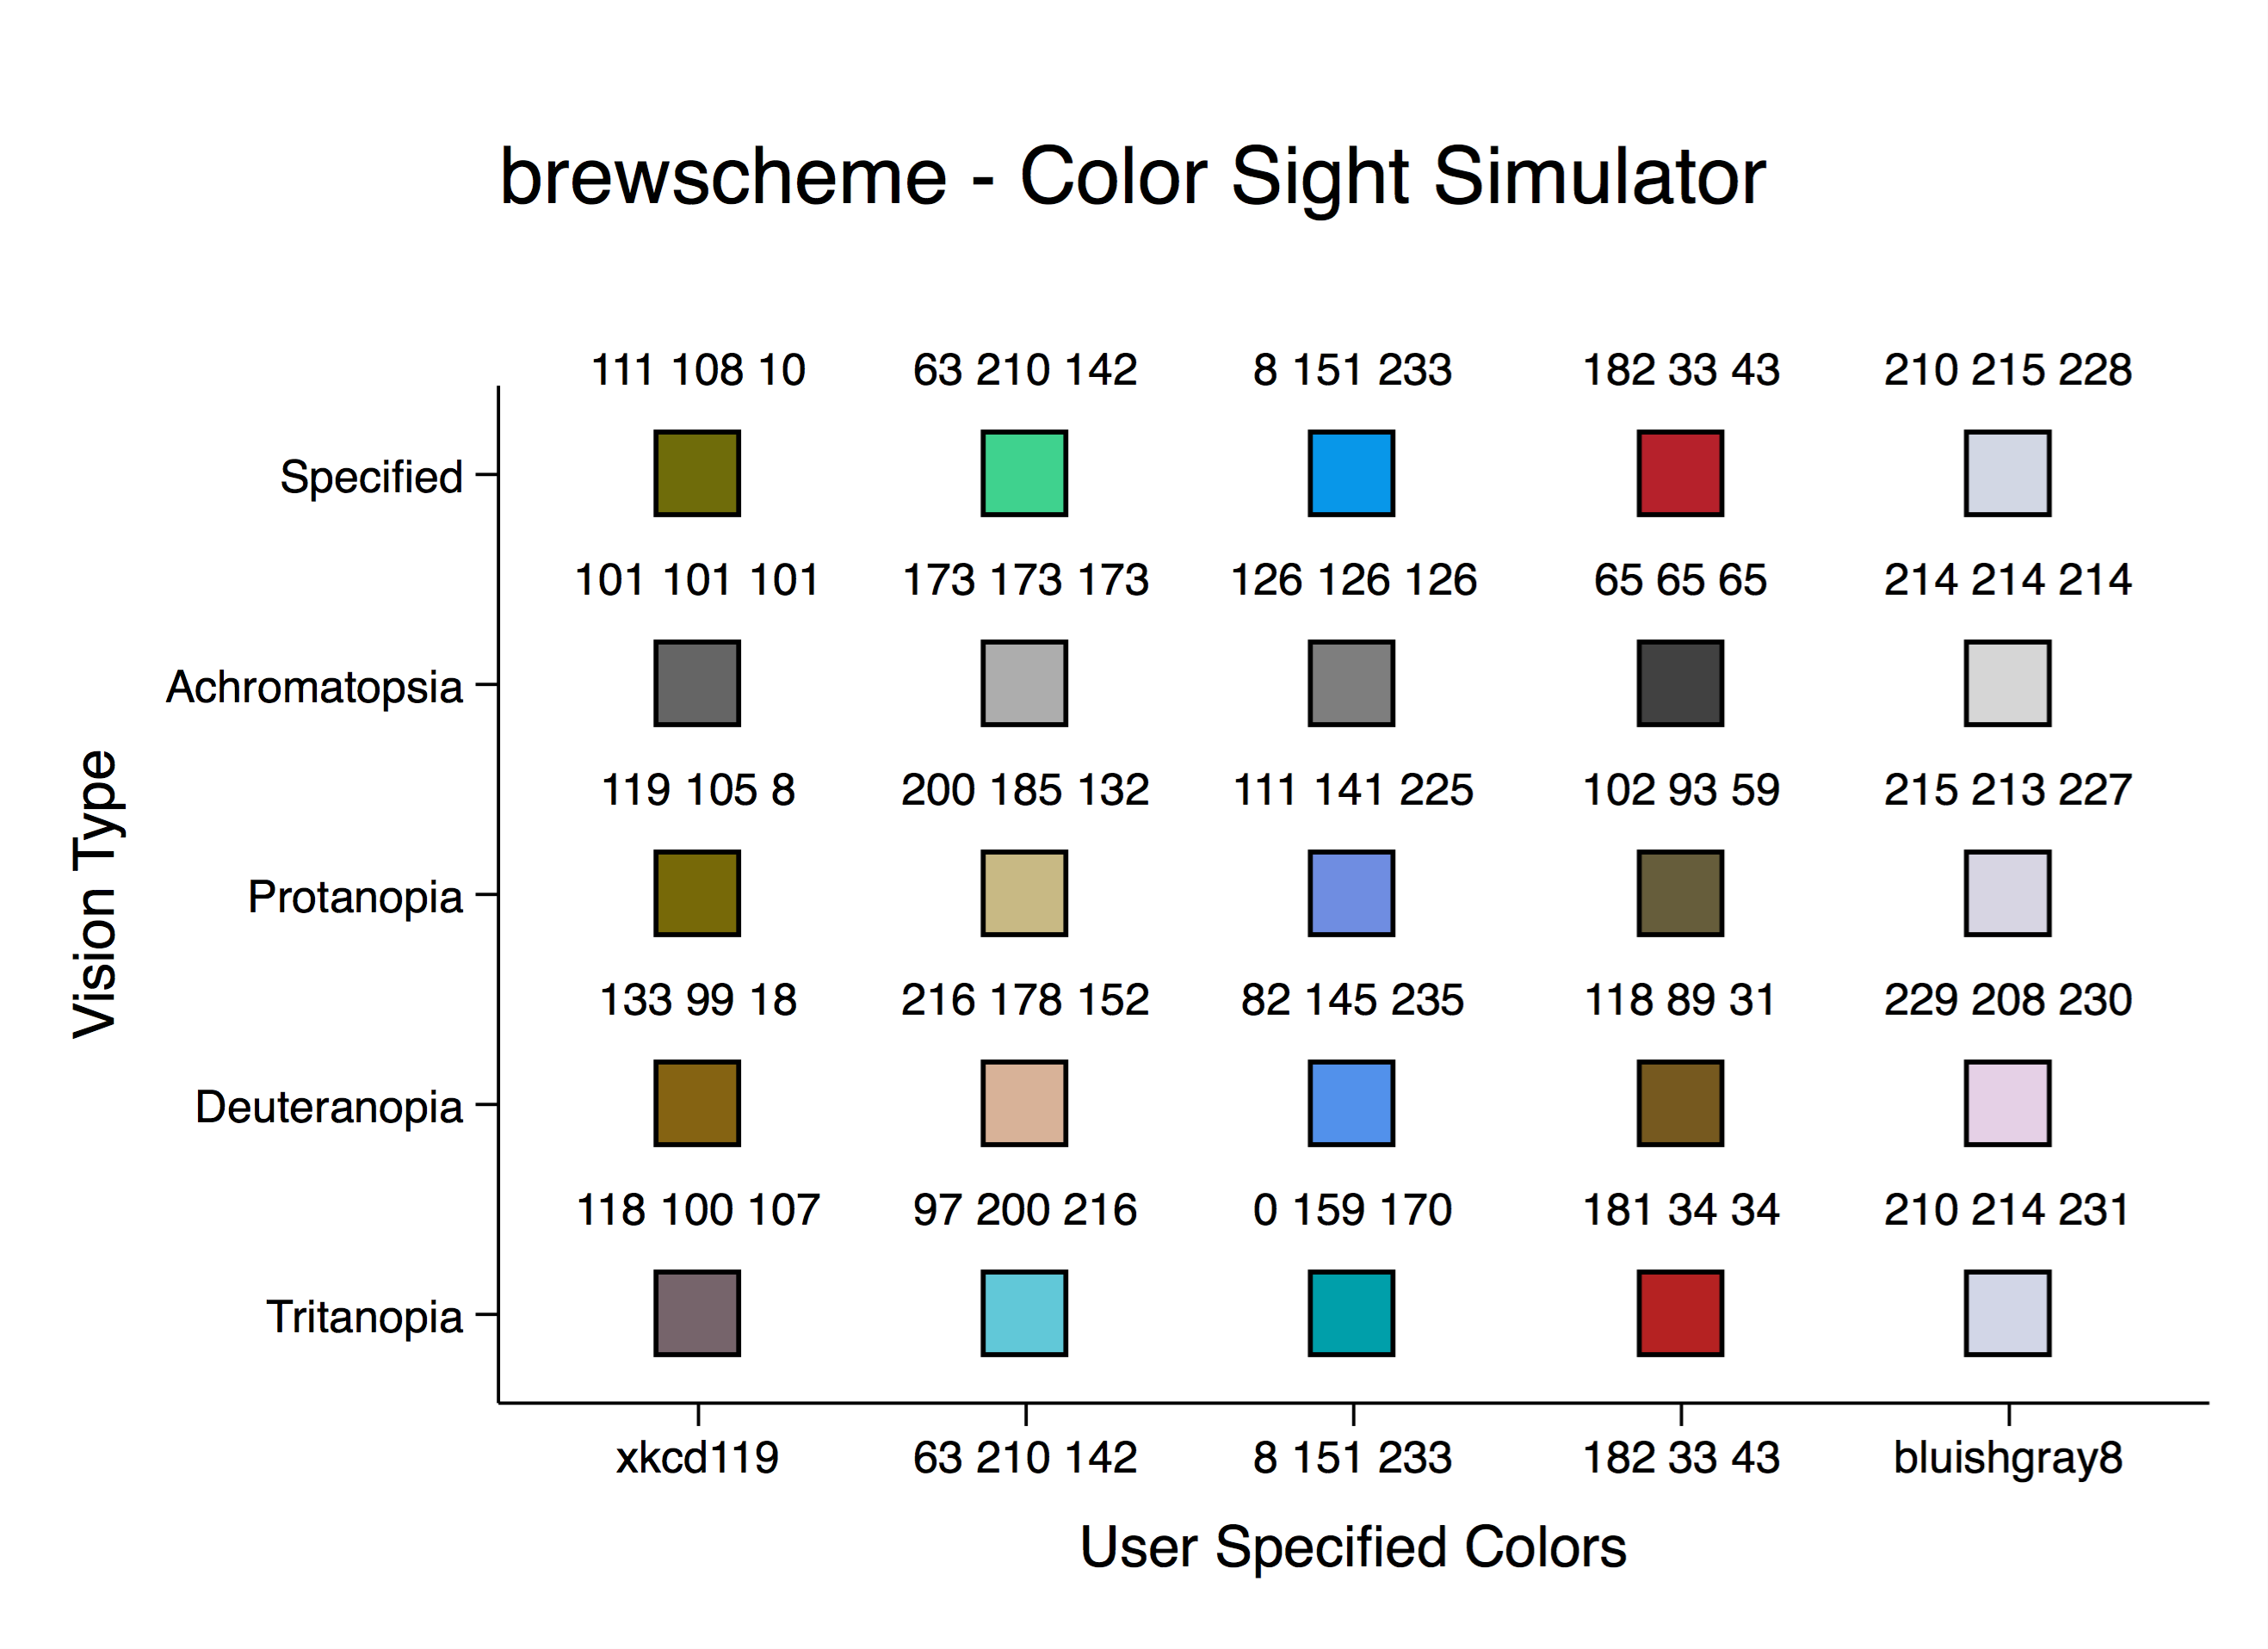
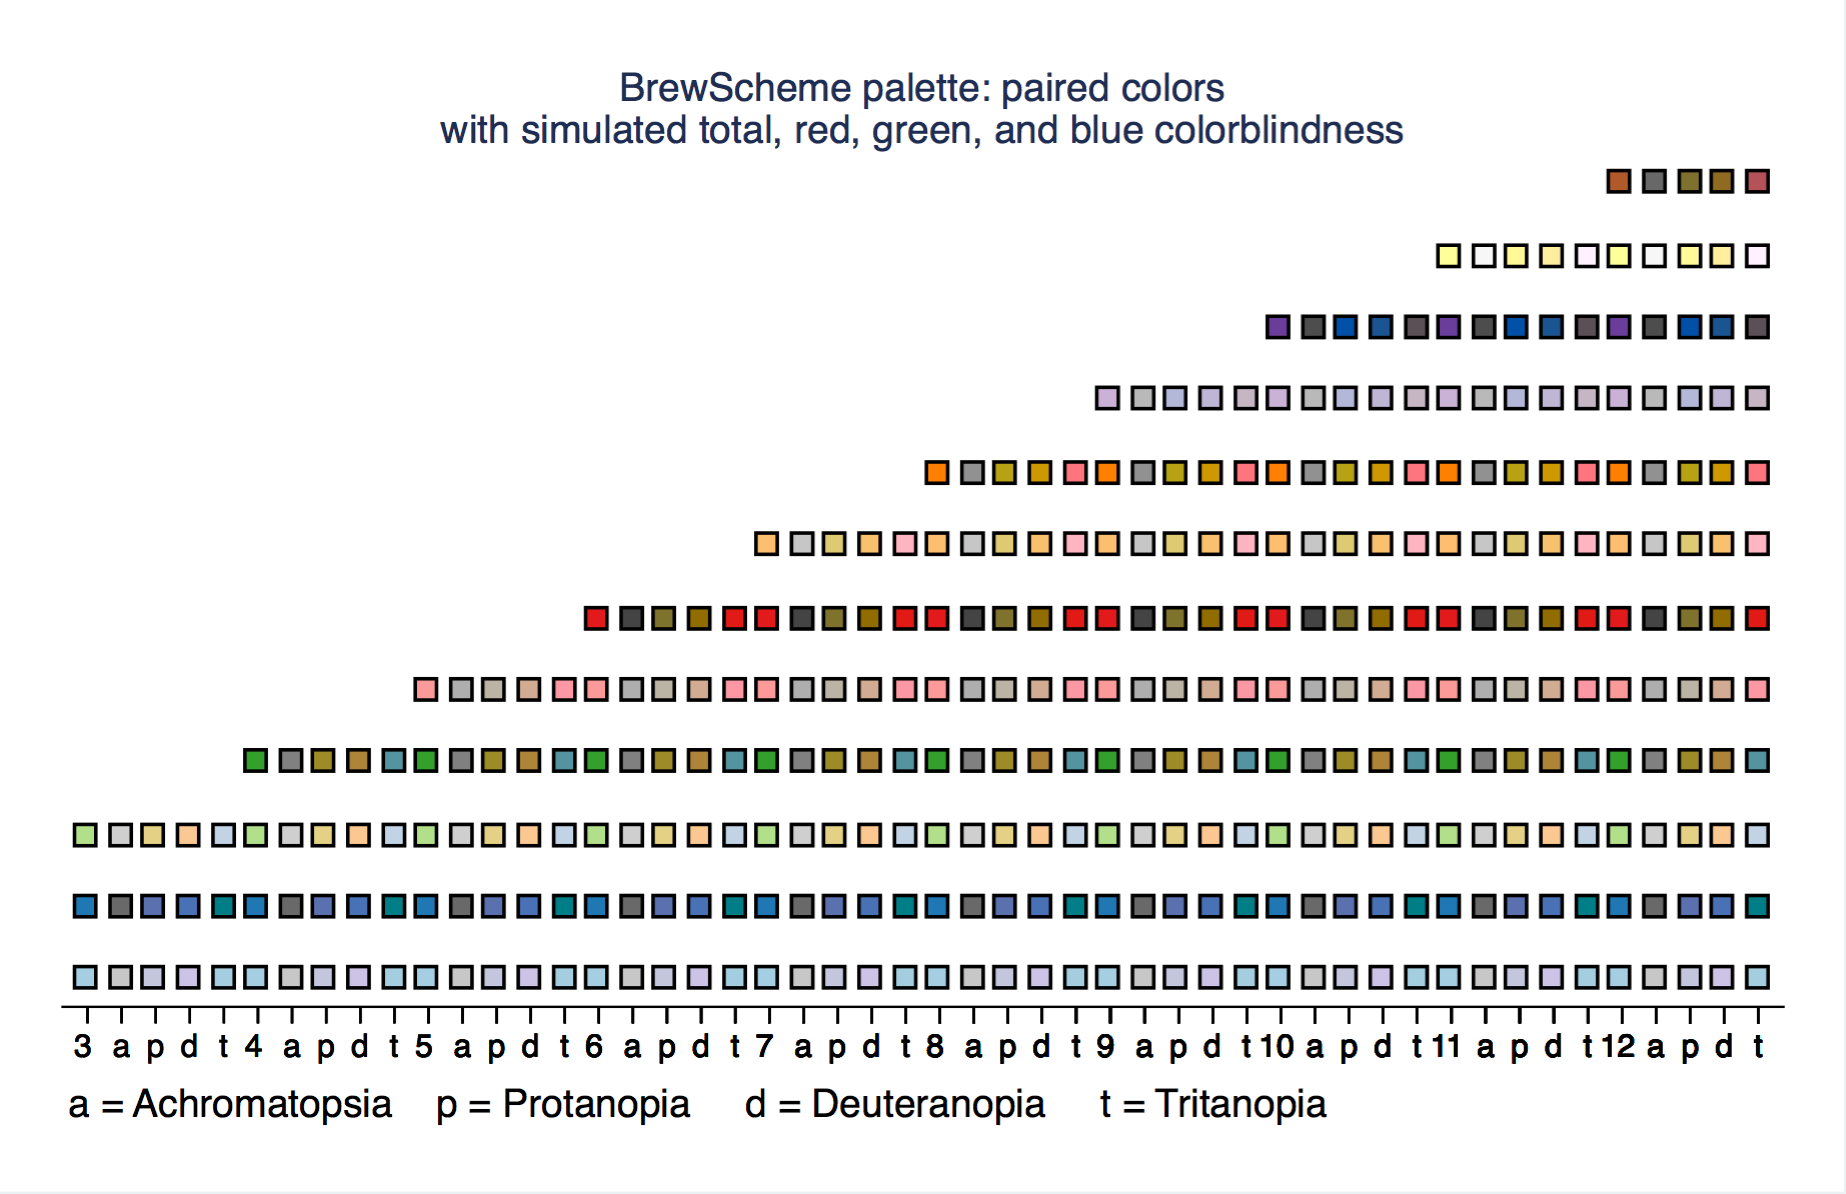
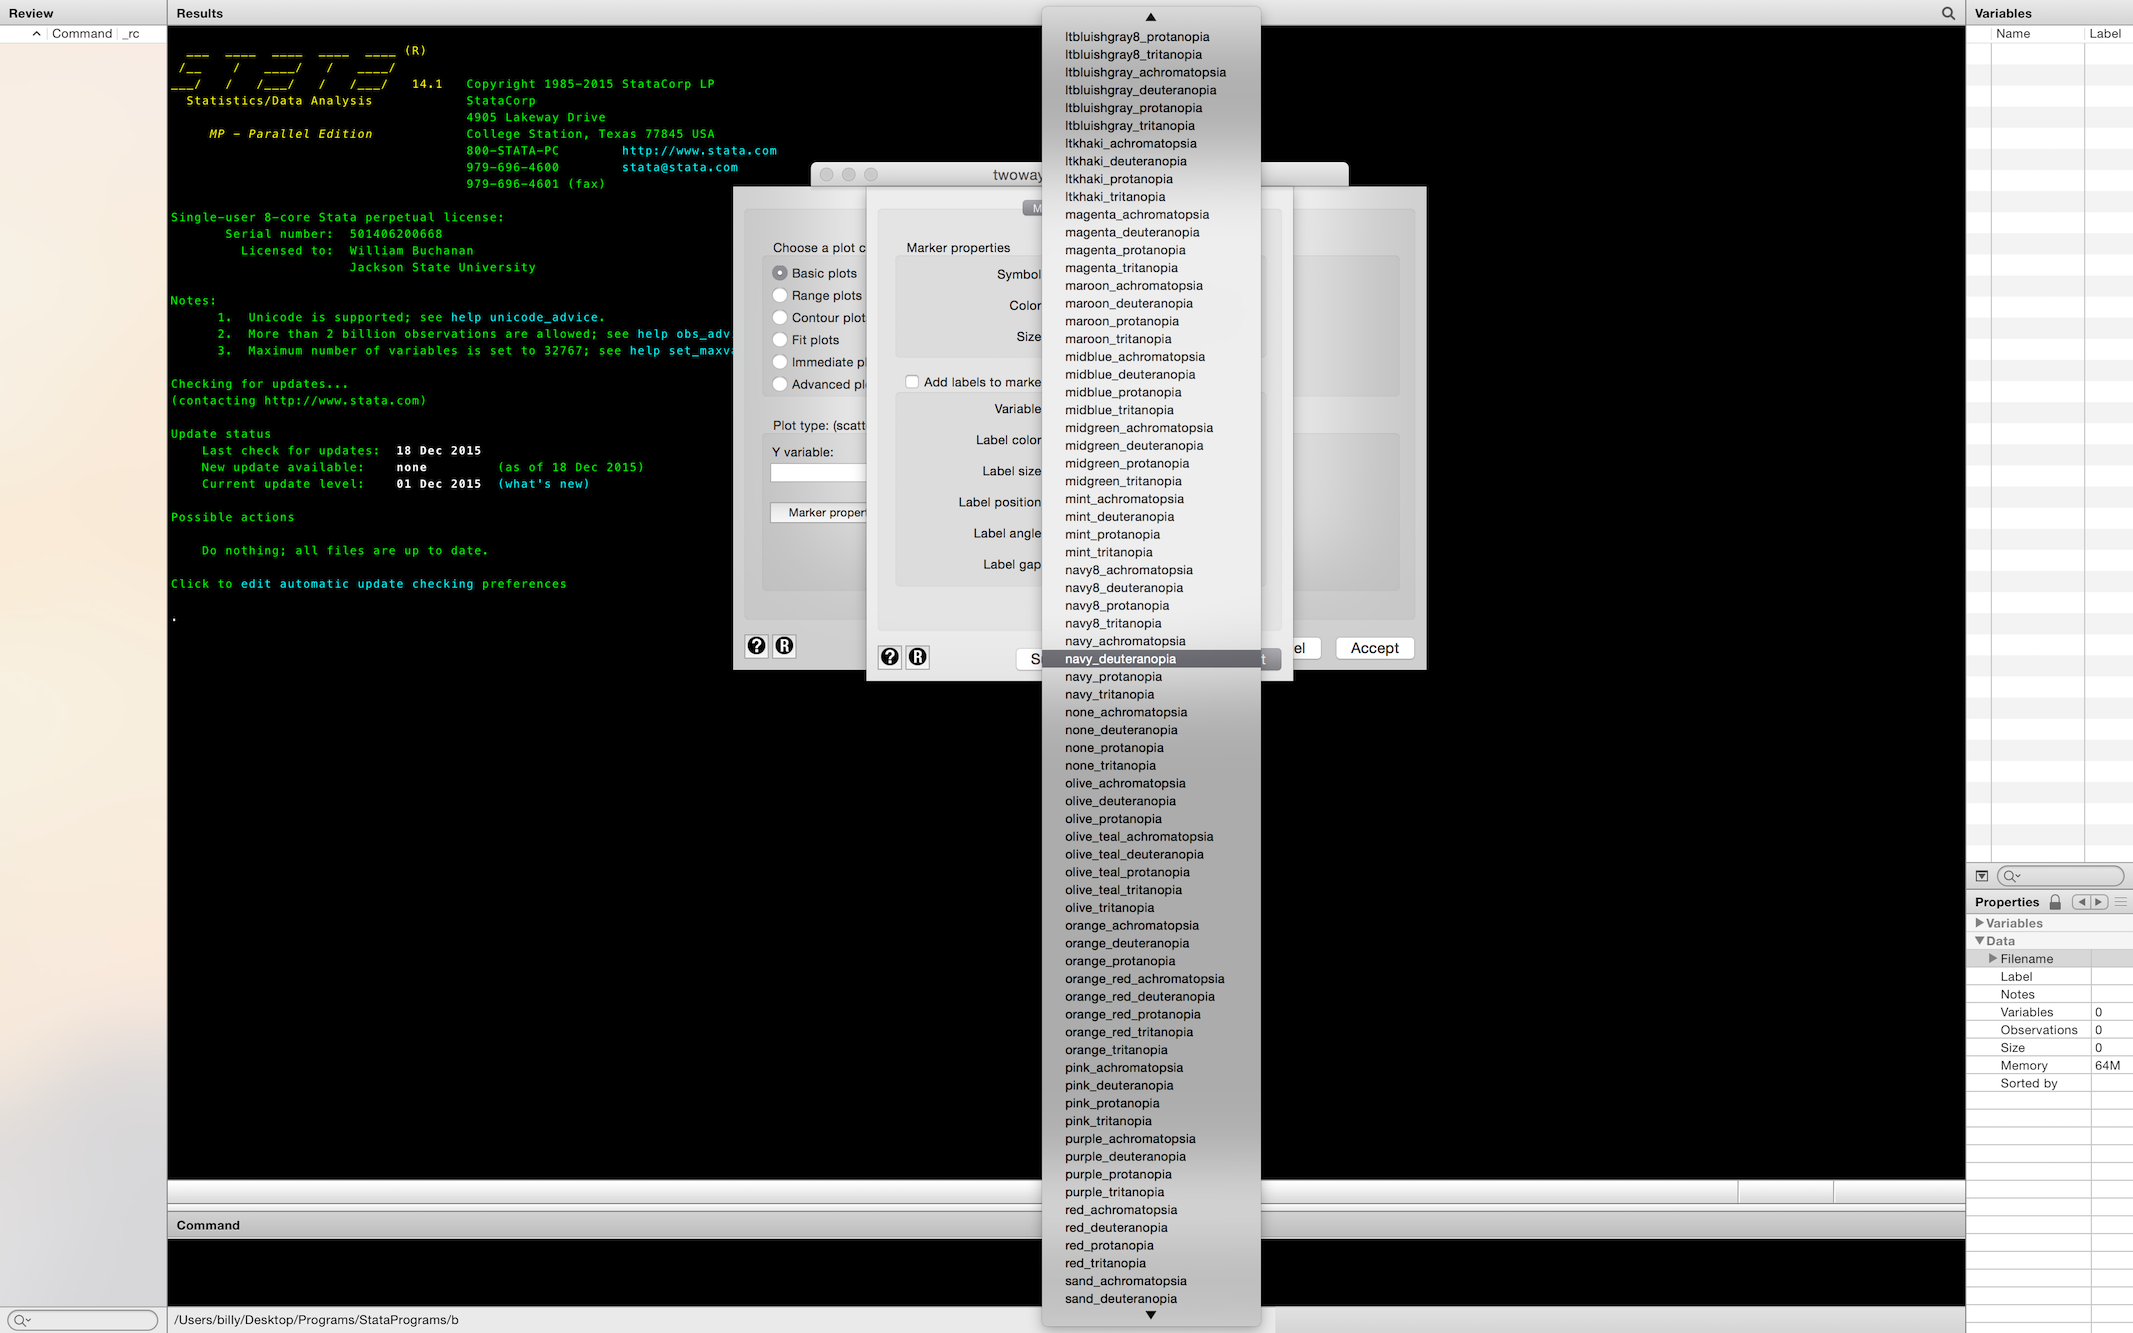
    A few folks have provided some very helpful feedback that led to changing some documentation and developing a bit more information about installation. Additionally, I've updated some of the project site resulting in a page containing views of each of the palettes that would be available (http://wbuchanan.github.io/brewscheme/brewviewer/), an update to the color sight impairment simulation program that now accepts multiple arguments that are either RGB strings or named color styles (http://wbuchanan.github.io/brewscheme/brewcbsim/), and a bit to show what the named color selection looks like after using the brewcolors program to install the named colors from XKCD and how existing named color styles get translations to simulate their appearance to individuals with color sight impairments (http://wbuchanan.github.io/brewscheme/about.html).

    A few examples can be seen here:


    The newest version is available by using the following command:

    Code:
    net inst brewscheme, from("http://wbuchanan.github.io/brewscheme") replace
    There is also a new program that checks for the required Mata libraries when several programs run and compiles the library from source if the version you have is out of date.

  • #2
    There is an update for brewscheme available from the project repository:

    Code:
    net inst brewscheme, from("http://wbuchanan.github.io/brewscheme") replace
    That includes a fix that I've been working on for close to a year now. After lots of hunting, I finally found the single line of code that was breaking the functionality of brewscheme when used with contour plots. The example below is from the project page:

    Code:
    // Change the end of line delimiter
    #d ;
    
    // Generate the theme file used to simulate ggplot2 aesthetics
    brewtheme ggtheme, numticks("major 5" "horizontal_major 5"
    "vertical_major 5" "horizontal_minor 10" "vertical_minor 10")
    color("plotregion gs15" "matrix_plotregion gs15" "background gs15"
    "textbox gs15" "legend gs15" "box gs15" "mat_label_box gs15"
    "text_option_fill gs15" "clegend gs15" "histback gs15"
    "pboxlabelfill gs15" "plabelfill gs15" "pmarkbkfill gs15"
    "pmarkback gs15") linew("major_grid medthick" "minor_grid thin"
    "legend medium" "clegend medium") clockdir("legend_position 3")
    yesno("draw_major_grid yes" "draw_minor_grid yes"
    "legend_force_draw yes" "legend_force_nodraw no"
    "draw_minor_vgrid yes" "draw_minor_hgrid yes"
    "extend_grid_low yes" "extend_grid_high yes"
    "extend_axes_low no" "extend_axes_high no")
    gridsty("minor minor") axissty("horizontal_default horizontal_withgrid"
    "vertical_default vertical_withgrid") linepattern("major_grid solid"
    "minor_grid solid") linesty("major_grid major_grid"
    "minor_grid minor_grid") ticksty("minor minor_notick"
    "minor_notick minor_notick")
    ticksetsty("minor_vert_default minor_vert_withgrid")
    gsize("minortick_label minuscule" "minortick tiny")
    numsty("legend_cols 1" "legend_rows 0" "zyx2rows 0"
    "zyx2cols 1") verticaltext("legend top");
    
    // Change end of line delimiter back to carriage return
    #d cr
    
    // Now five colors from same palette using the ggplot2 inspired theme
    brewscheme, scheme(ggplot2ex1) allsty(ggplot2) allc(3) ///
    themef(ggtheme)
    
    // Load example data
    sysuse sandstone.dta, clear
    
    // Create contour plot with brewscheme generated scheme file
    tw contour depth northing easting, scheme(ggplot2ex1)
    This generates a graph that looks like:


    There are a few other minor bug fixes that have been made as well. I'm in the process of putting together a bit more documentation and an article that will be released with the version 1.0 release.

    Comment


    • #3
      Version 1.0 of brewscheme is now available from the SSC archives.

      Comment


      • #4
        Originally posted by wbuchanan View Post
        Version 1.0 of brewscheme is now available from the SSC archives.
        a package error when i attempt installation - this is what i get:
        Code:
        . ssc install brewscheme
        checking brewscheme consistency and verifying not already installed...
        file http://fmwww.bc.edu/repec/bocode/b/btabovebelow.sthlp not found
        could not copy http://fmwww.bc.edu/repec/bocode/b/btabovebelow.sthlp
        (no action taken)
        
        ssc install: apparent error in package file for brewscheme; please notify
        [email protected], providing package name
        r(601);
        also - do you have a collection of pre-built schemes that you could point to ?
        i have enjoyed one of your presentations at the 2015 Stata conference, and have been following your work on this package. thank you.
        sincerely,
        george hoffman
        Last edited by George Hoffman; 27 Mar 2016, 12:51.

        Comment


        • #5
          Hi George Hoffman,

          ​The timing couldn't be better, but I just got an email from KitBaum saying that the error is squared away now; When building the zip file for the SSC I forgot to include the subpages for the brewtheme help file (the file referenced above is one of those such files). So, you should have no issues installing from the SSC archives now. In terms of any collections of pre-built schemes, I don't have any specifically, but I've attached a few from some of the examples listed on the project page. I tried to attach scheme files here but got an error saying it was an invalid file type. I'll try to get something posted in the coming days and will try to put a note here once I do.

          Thanks again,
          Billy -- NORMAL --

          Comment


          • #6
            @billy - thank you - i have successfully installed brewscheme from ssc.

            Comment


            • #7
              I got the following errors trying to brew my first scheme using the command from the help file:

              Code:
              .  brewscheme, scheme(set1) allst(set1) allc(8) allsat(80)
              The directory C:\Program Files (x86)\Stata/ado/personal/b was successfully created.
              file C:\Program Files (x86)\Stata/ado/personal/brewcolors/colordb.dta not found
                               stata():  3598  Stata returned error
                     brewcolors::new():     -  function returned error
                          brewcolors():     -  function returned error
                               <istmt>:     -  function returned error
              r(2);
              
              .
              my adopath is:
              Code:
              . adopath
                [1]  (BASE)      "C:\Program Files (x86)\Stata\ado\base/"
                [2]  (SITE)      "C:\Program Files (x86)\Stata\ado\site/"
                [3]              "."
                [4]  (PERSONAL)  "C:\Program Files (x86)\Stata/ado/personal/"
                [5]  (PLUS)      "C:\Program Files (x86)\Stata/ado/plus/"
                [6]  (OLDPLACE)  "C:\Program Files (x86)\Stata/ado/oldplace/"
              the file brewmeta.dta was created in PERSONAL\b, and extras.dta was created in PERSONAL\brewuser, but no brewcolors directory.

              Comment


              • #8
                Hi George Hoffman,

                I think I may have forgotten to include a little bit in the package file that I sent to Kit. Try running:

                Code:
                brewcolordb, replace
                And then you should be good to go. Because the base scheme files contain named color styles, this command is basically the first thing to run after installation so it can create the dataset referenced above. It parses all of the RGB values from all of the named color styles on the system and then generates the transformed RGB values for each of them under the different types of color sight impairments. I also noticed that some of the information on the project page is slightly out of date (e.g., just before the version 1.0 release I went through and modified the "refresh" options to use "replace" instead and saw that it wasn't reflected in the about section of the project page).

                I also don't have any non-*nix based systems at home, but once I get to the office in a little bit I'll try going through the installation process from the work machine and will add better instructions in some of the posts here on StataList and will also update the project page over the next few days.

                Thanks again,
                Billy

                Comment


                • #9
                  wbuchanan -
                  i have successfull installed your package now (win 7 x64). i'm working on learning, but have built two schemes starting from examples. thank you very much for this work.
                  george

                  Comment


                  • #10
                    George Hoffman awesome! Glad to hear things are working out for you. Another user noted an issue with installation in a networked environment and I ended up stumbling into a new minor bug (e.g., if you use the category10 palette in a scheme it won't select the colors from the palette correctly so I've been trying to figure out and work through those things as well). I haven't yet made it around to setting up something else, but I figured I could also set up something like a user-contributed section in the source repository so people could share different schemes/themes that they think others may find useful.

                    Comment


                    • #11
                      George Hoffman just started getting a patch in place for the issue I mentioned above and have an example showing the fix:

                      Code:
                      // Change the end of line delimiter
                      #d ;
                      
                      // Generate the theme file used to simulate ggplot2 aesthetics
                      brewtheme ggtheme, numticks("major 5" "horizontal_major 5" "vertical_major 5"     
                      "horizontal_minor 10" "vertical_minor 10") color("plotregion gs15"          
                      "matrix_plotregion gs15" "background gs15" "textbox gs15" "legend gs15"       
                      "box gs15" "mat_label_box gs15" "text_option_fill gs15" "clegend gs15"        
                      "histback gs15" "pboxlabelfill gs15" "plabelfill gs15" "pmarkbkfill gs15"      
                      "pmarkback gs15") linew("major_grid medthick" "minor_grid thin" "legend medium"    
                      "clegend medium") clockdir("legend_position 3") yesno("draw_major_grid yes"     
                      "draw_minor_grid yes" "legend_force_draw yes" "legend_force_nodraw no"        
                      "draw_minor_vgrid yes" "draw_minor_hgrid yes" "extend_grid_low yes"         
                      "extend_grid_high yes" "extend_axes_low no" "extend_axes_high no")          
                      gridsty("minor minor") axissty("horizontal_default horizontal_withgrid"       
                      "vertical_default vertical_withgrid") linepattern("major_grid solid"        
                      "minor_grid solid") linesty("major_grid major_grid" "minor_grid minor_grid")     
                      ticksty("minor minor_notick" "minor_notick minor_notick")               
                      ticksetsty("major_vert_withgrid minor_vert_nolabel"                 
                      "major_horiz_withgrid minor_horiz_nolabel"                      
                      "major_horiz_nolabel major_horiz_default"                       
                      "major_vert_nolabel major_vert_default") gsize("minortick_label minuscule"        
                      "minortick tiny") numsty("legend_cols 1" "legend_rows 0" "zyx2rows 0" 
                      "zyx2cols 1") verticaltext("legend top");
                      
                      // Change the end of line delimiter back to a carriage return
                      #d cr
                      
                      // Creates the scheme using the D3js category10 palette
                      brewscheme, scheme(ggd3) allsty(category10) allc(10) themef(ggtheme)          ///   
                      symbols(diamond triangle square)
                      
                      // Load the auto.dta dataset
                      sysuse auto.dta, clear
                      
                      // Create the same graph with each of the different schemes
                      tw  scatter mpg weight if rep78 == 1 || scatter mpg weight if rep78 == 2 ||  ///    
                      scatter mpg weight if rep78 == 3 || scatter mpg weight if rep78 == 4 ||       ///    
                      scatter mpg weight if rep78 == 5,  scheme(ggd3) legend(order(1 "rep78 == 1"  ///   
                      2 "rep78 == 2" 3 "rep78 == 3" 4 "rep78 == 4" 5 "rep78 == 5")) name(ggd3, replace)
                      Click image for larger version

Name:	ggd3-Example.png
Views:	1
Size:	257.1 KB
ID:	1333851


                      Previously, the use of the -levelsof- command was causing the colors to be selected after Stata had sorted them. Now the colors are retrieved in the order in which they appear in the file that houses the different palettes. I've not yet pushed the changes into the other branches just yet, but there should be a patched version available before the end of the week.

                      Comment


                      • #12
                        wbuchanan, I installed brewscheme via ssc a few minutes ago.

                        When I try to execute the first example from your project page, I get an error message (please see below)

                        Code:
                         . brewscheme, scheme(set1) allst(set1) allc(5) allsat(80) 
                        file could not be opened
                        r(603); t=0.04 16:06:08
                        Thanks very much for your work on this program. Any help with this error would be appreciated. I'm running Stata MP 14.1 on a Mac with OS X Yosemite.

                        Comment


                        • #13
                          I need some help with these questions. Any insight would be greatly appreciated. Using the STATA software and a data set uniquely assigned to your group, answer the following three questions:
                          1. Course grades at Southeast Normal University are determined by 11 weekly exams. A student had reasonable good grades in 10 of the 11 exams in one of his courses, but missed one exam for health reasons. The course instructor estimates the following regression
                            Yi = μ + βXi + εi
                            where Yi represents student exam grades and Xi represents class average grades for
                            the 10 exams that the student took. The instructor then assigns the grade Y =Y(88)=μˆ+βˆ×88
                            for the missing examination, where 88 is the class average grade for the exam that the student missed. Using data labelled “grades” in the Excel file,
                            1. (a) find the regression coefficients μˆ and βˆ. In addition, find the grade Y (88) that was assigned. Is it more or less than the student’s average score on the other exams?
                            2. (b) How accurate is the value Y (88) as an estimate of the expected grade that the student should achieve when the class average is 88? Find a 95% confidence interval for this mean value.
                          2. A study is done to test air quality as a function of three possible pollutants CO2, NOx and SOx. Data labelled “air” in the Excel file shows air quality index on a typical Summer day in 20 cities.
                            1. (a) Run a regression of air quality (Yi) on the three pollution covariates (CO2, NOx and SOx) and construct an appropriate ANOVA table. Do the three pollutant variables provide a fit to the air quality measurements that is significantly better than no fit at all? What are the numbers of degrees of freedom (both numerator and denominator) of the F-test that answers this question? What is the p-value?
                            2. (b) What is the regression function that STATA finds? Suppose that the statistical study is done in a city with pollutant levels CO2 = 90, NOx = 20, and SOx = 12. What air quality value would the regression function predict for that city?
                            3. (c) Which of the three pollutant variables have coefficients in the regression function that are significantly different from zero? What are their p-values?


                          (d) What are the correlation coefficients between air quality and each of the three pollutant variables? Are these correlation coefficients consistent with your an- swer to part (c)?
                          3. A physician is interested in how the time to recover from a newly-discovered viral illness depends on the patient’s initial antibody levels. The physician also wants to know if the recovery time depends on the gender of the patient, both overall and also after the initial antibody level is allowed for. Recovery times in days (Y ) and antibody levels (X) are recorded for a number of female and male patients in data labelled “antibody” in the Excel file. Note that the results for the female subjects are labelled 1.
                          1. (a) Is there a significant difference in recovery time between the two genders, ignor- ing antibody for the moment? Carry out a t-test to find out.
                          2. (b) Is there a significant linear relationship between recovery time and initial anti- body level, ignoring gender for the moment?
                          3. (c) What is the linear regression for recovery time on both gender (X1) and initial antibody level (X2)? What recovery time would this linear regression predict for Gender = Female and Antibody = 100? Explain carefully how you come up with this result.
                          4. (d) Does this regression fit recovery times better than no variables at all? What is the p-value of the F-test? What is the model R2? How much has it improved over part (b)?
                          5. (e) Which of the variables in the regression (gender and antibody) have regression coefficients that are significantly difference from zero? What are their p-values? Find a 95% confidence interval for the slope parameter for antibody in the regression on two variables.


                            DATA:
                            Grades:


                            Exam: Student: ClassAv:
                            1 50 36
                            2 60 43
                            3 85 90
                            4 65 54
                            5 91 82
                            6 69 50
                            7 59 51
                            9 82 75
                            10 75 65
                            11 80 65
                          6. antibody:

                            Recovery Sex Antibody
                            32 0 115
                            28 0 108
                            24 0 100
                            31 0 86
                            25 0 99
                            35 0 116
                            28 0 103
                            30 0 117
                            27 0 102
                            33 0 117
                            29 0 100
                            37 1 111
                            31 1 97
                            38 1 116
                            43 1 111
                            38 1 105
                            34 1 113
                            32 1 117
                            33 1 115
                            34 1 112


                          Comment


                          • #14
                            John Marvel did you first run:

                            Code:
                            brewcolordb, replace
                            Before -brewtheme- or -brewscheme- will work you first need to run the command above to generate the look up table of the RGB values for the named color styles on your system. If that doesn't resolve things for you rerun the command that was giving you issues after you:

                            Code:
                            set tracedepth 3
                            set trace on
                            And then copy the output from the trace into a new issue.

                            Comment


                            • #15
                              John Marvel on a slightly unrelated note, in the process of trying to create an example for someone else I ended up finding a bug and also worked on addressing some issues with networked installations. If this turns out to be an actual bug I'll hold off on sending the patch to the SSC archives, but if it isn't and you wanted the latest version you can install it directly from the project page using:

                              Code:
                              net inst brewscheme, from("http://wbuchanan.github.io/brewscheme/")
                              Just be sure to install the current version and to make sure that some of the other files that may not automatically get uninstalled are removed you can use:

                              Code:
                              loc files libbrewscheme.mlib brewterpolate.jar filesys.jar
                              foreach v of loc files {
                                   cap findfile `v'
                                   if !mi(`"`r(fn)'"') qui: erase "`r(fn)'"
                              }
                              To make sure they are removed as well.

                              Comment

                              Working...
                              X