Thanks to Kit Baum's work maintaining the SSC archives, I can share a program that I've been working on for a little bit with the rest of the Stata community. The package
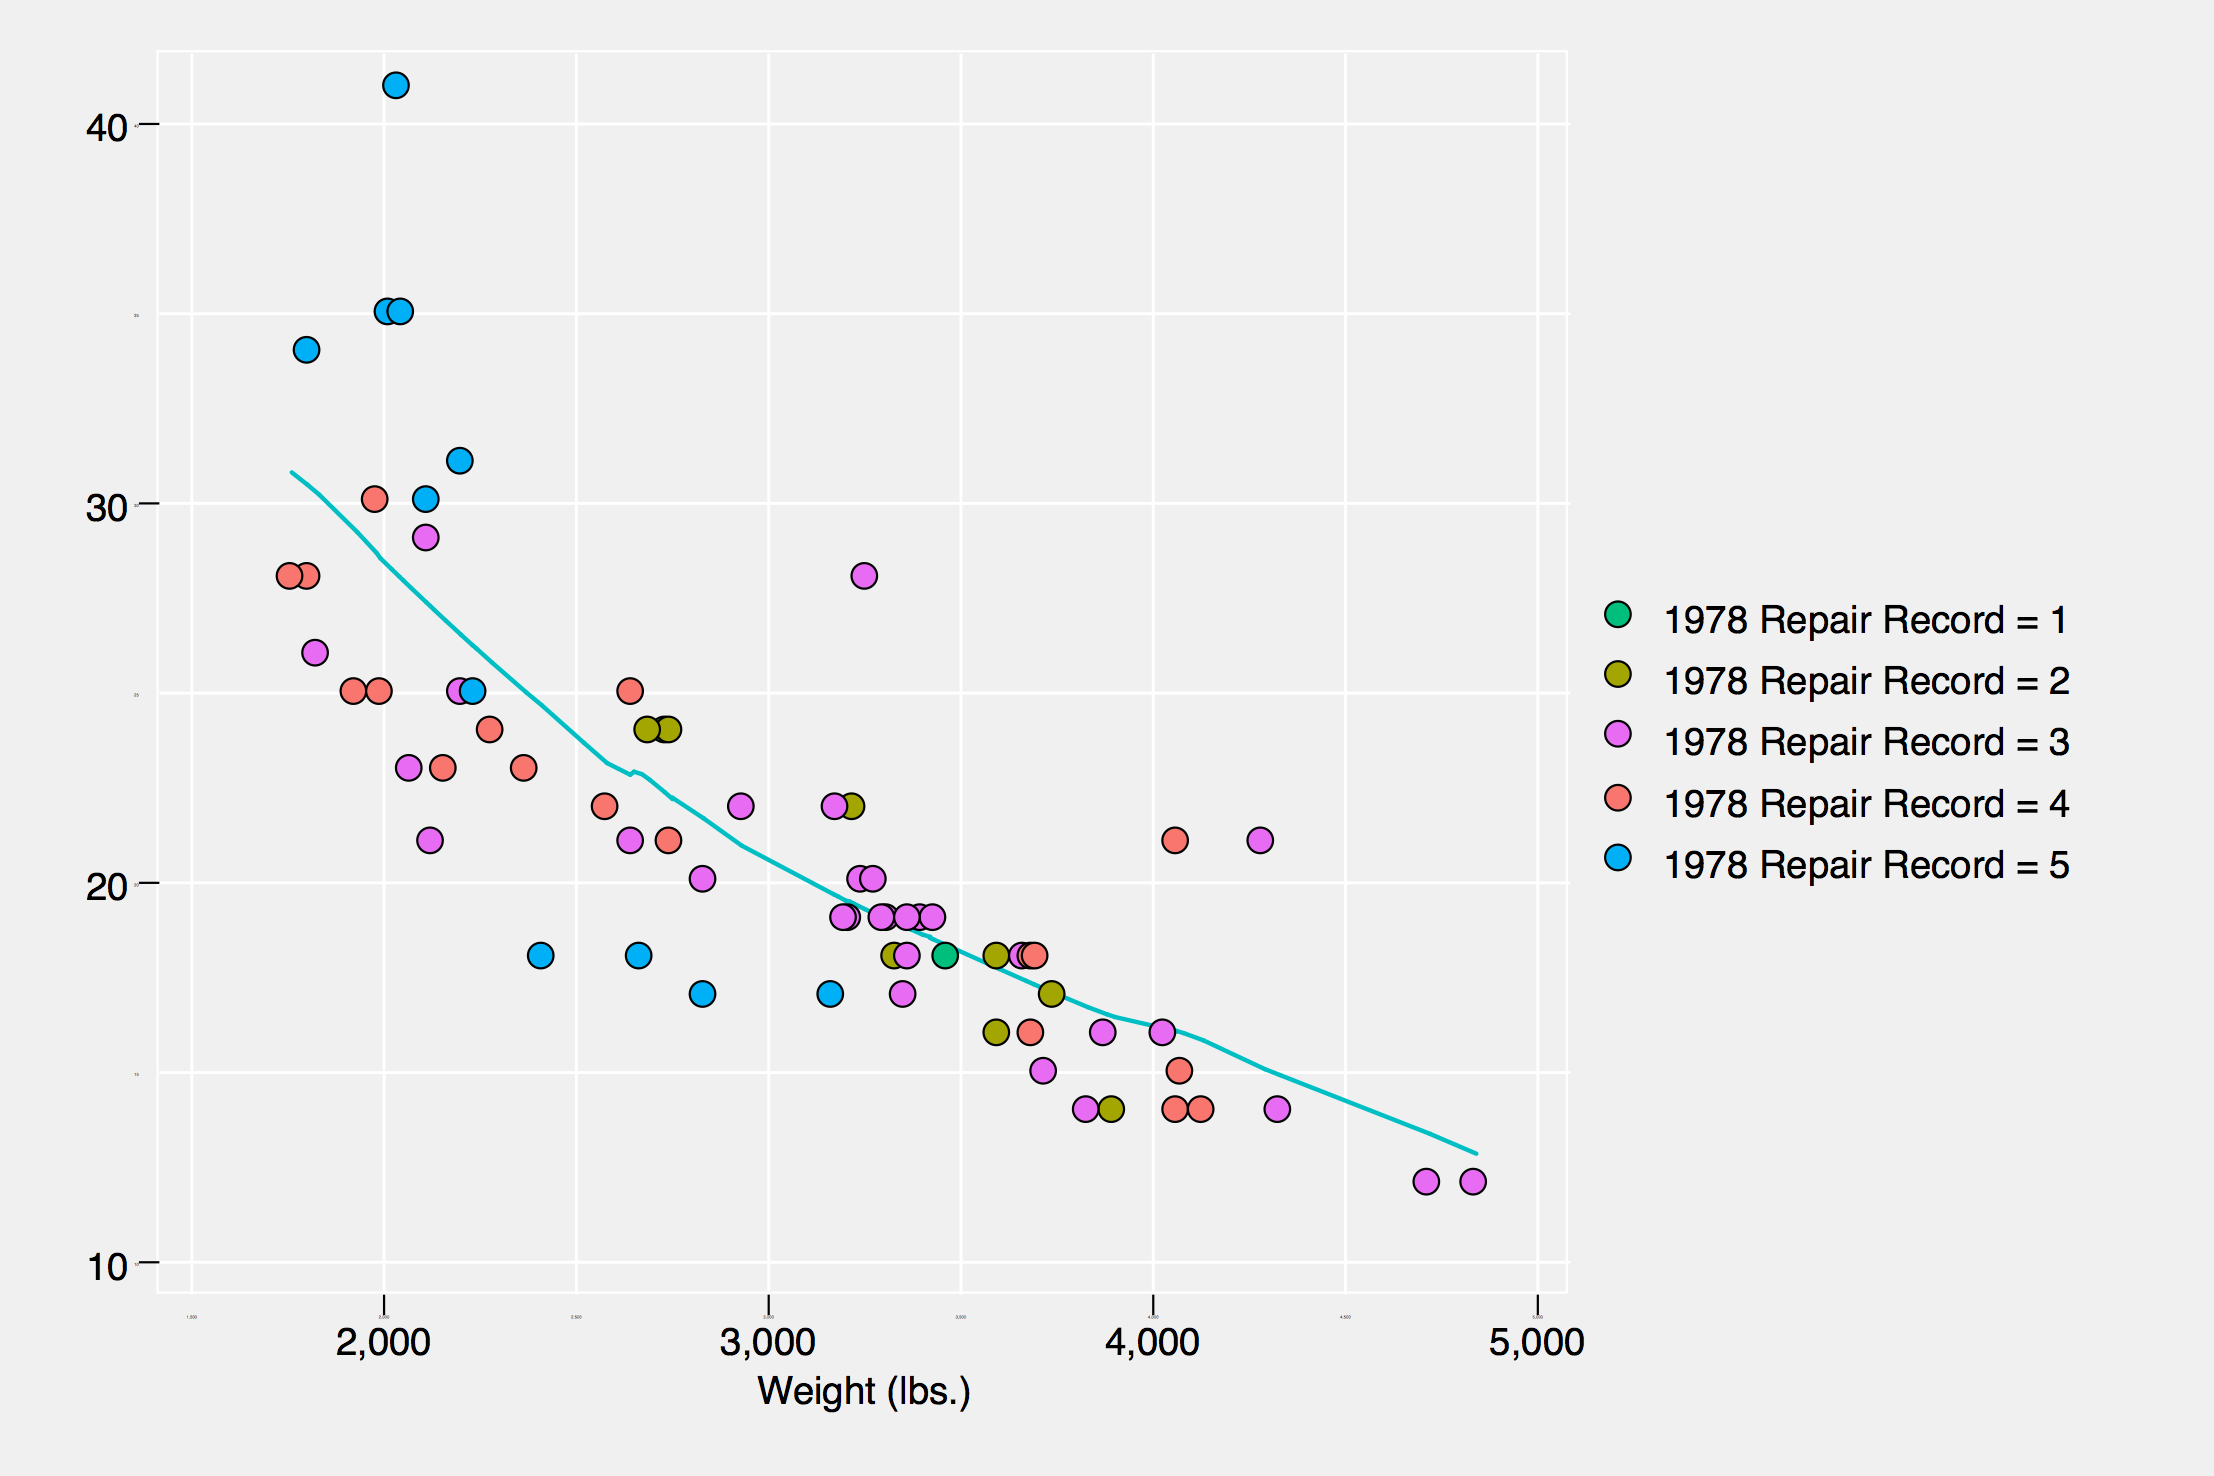
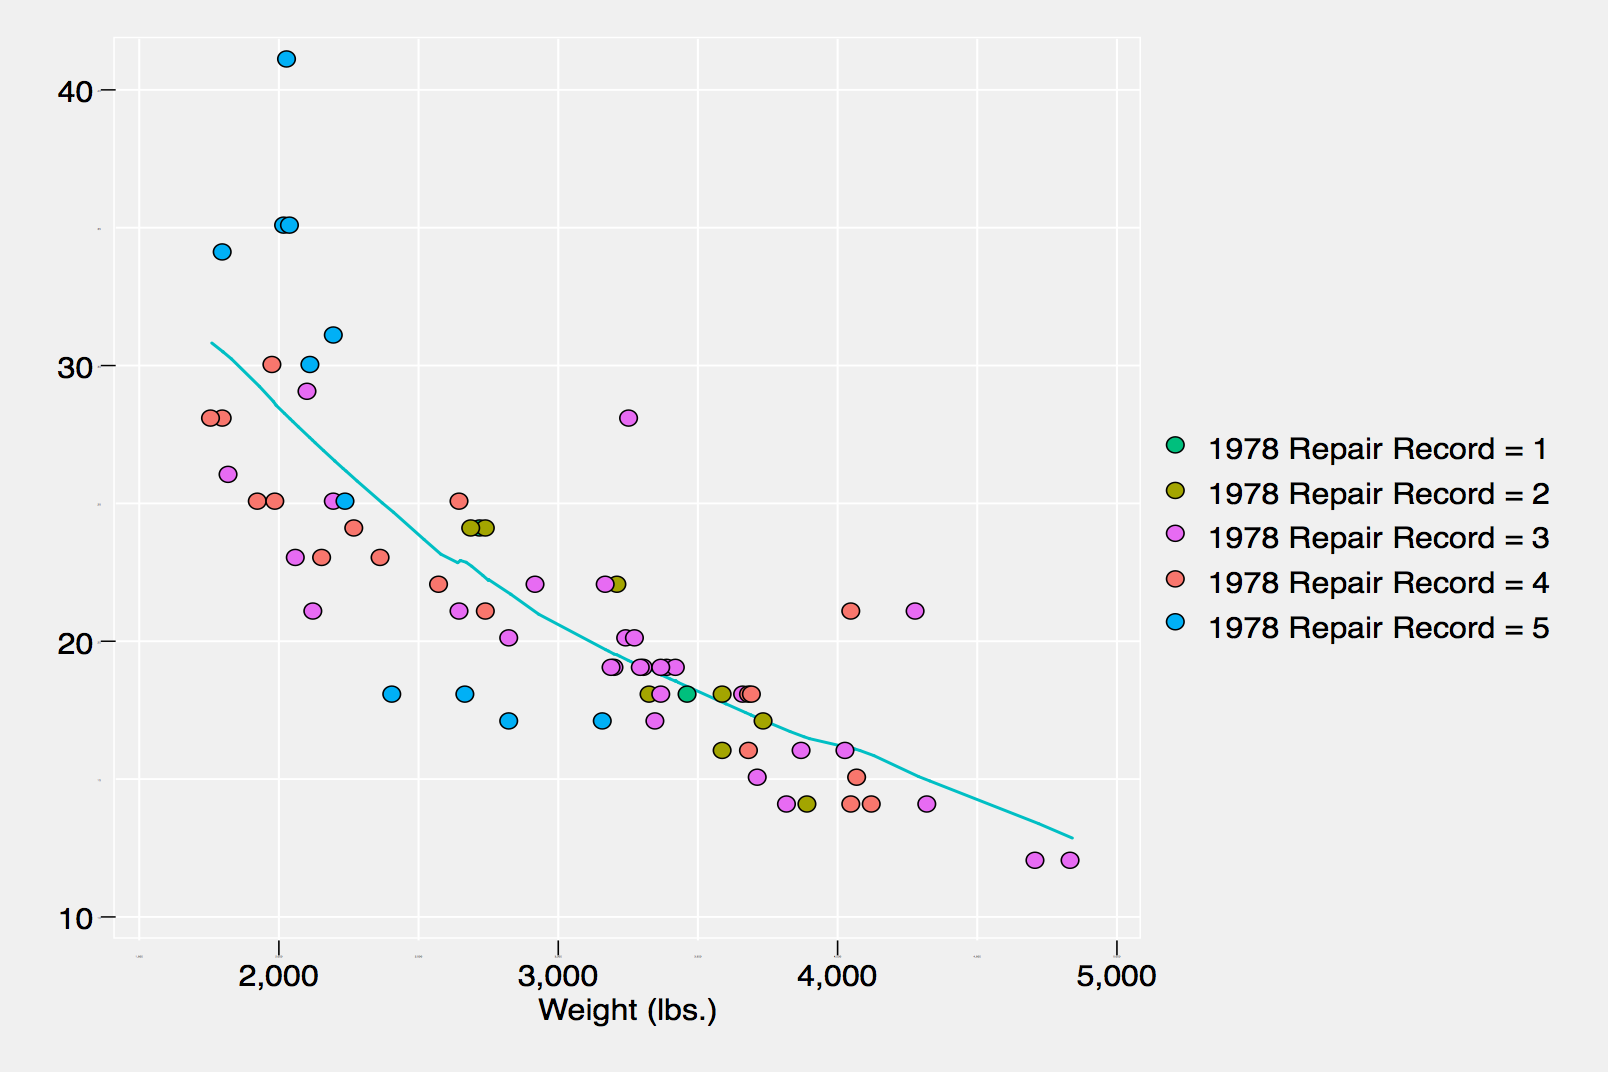
provides functionality analogous to the <a href="https://cran.r-project.org/web/packages/RColorBrewer/index.html">RColorBrewer</a> package in R, with a few notable exceptions. As a simple example, you can create a scheme file with a single color palette (which also makes some modifications to other defaults) using:


However, unlike RColorBrewer, you can generate a scheme using multiple palettes simultaneously with varying numbers of colors (the varying number of colors part still has a few bugs that I am working on fixing but generally works fairly well).


Additionally, the program also provides access to all of the metadata from the palettes developed by Cynthia Brewer at www.colorbrewer2.org:
In addition to the version archived in the SSC, you can access a development version of the package from:
I'm already working on adding some additional features for future releases, but welcome any/all feedback.
Billy Buchanan
Data Scientist
Minneapolis Public Schools
Code:
brewscheme
Code:
// Load the auto data set
sysuse auto, clear

// Create a new scheme file for all graph types
brewscheme, scheme(test) allstyle(dark2) allcolor(7)

// Make a simple graph using Stata defaults
tw scatter mpg length || lfit mpg length, name(stata, replace)

// Make the same graph using the scheme file you just created
tw scatter mpg length || lfit mpg length, scheme(test) name(brewscheme, replace)
However, unlike RColorBrewer, you can generate a scheme using multiple palettes simultaneously with varying numbers of colors (the varying number of colors part still has a few bugs that I am working on fixing but generally works fairly well).
Code:
// Create a new scheme file with different palettes and #s of color per palette
// for different graph types
brewscheme, barst(paired) barc(12) dotstyle(prgn) dotc(7) scatstyle(set1)     ///
scatc(9) linest(dark2) linec(8) somestyle(accent) somec(8) areast(dark2)     ///
areac(8) scheme(test2)

// Make a simple graph using Stata defaults
gr box price, over(rep78) name(stata, replace)

// Make the same graph using the scheme file you just created
gr box price, over(rep78) asyvars scheme(test2) name(brewscheme, replace)
Additionally, the program also provides access to all of the metadata from the palettes developed by Cynthia Brewer at www.colorbrewer2.org:
Code:
// This command allows you to check characteristics of the palettes
brewmeta accent, c(5)

// The output looks like this for the command with either no properties specified
The color palette accent with 5 colors is Not color blind friendly
The color palette accent with 5 colors is Possibly LCD friendly
The color palette accent with 5 colors is Not photocopy friendly
The color palette accent with 5 colors is Possibly print friendly
Code:
net inst brewscheme, from("http://www.paces-consulting.org/stata")
Billy Buchanan
Data Scientist
Minneapolis Public Schools

Comment